Impact of Wheat Tempering Conditions on Flour Particle Size and Thermo-Mechanical Properties
-
Neima Demssis Jemal
Food Science and Nutrition Research Sector, Kulumsa Agricultural Research, Ethiopian Institute of Agricultural Research, P. O. Box 2003, Addis Ababa, Ethiopia
Melaku Tafese Awulachew

Food Science and Nutrition Research Sector, Kulumsa Agricultural Research, Ethiopian Institute of Agricultural Research, P. O. Box 2003, Addis Ababa, Ethiopia
| Received 19 Feb, 2025 |
Accepted 15 May, 2025 |
Published 30 Sep, 2025 |
Background and Objective: In the baking and milling sectors, the rheological qualities of wheat flour and dough are crucial since they determine the flour’s quality and processing characteristics. Tempering conditions influence particle sizes and milling yield, which affect flour properties. This study evaluates the impact of tempering conditions-temperature (20-60̊C) and time (6-18 hrs)-on flour particle size and thermo-mechanical properties. Materials and Methods: The study analyzed flour samples obtained from wheat grains tempered at different conditions. Particle size distribution was measured using standard sieving techniques, with values recorded for D10, D50, D90, D(3,2) and D(4,3). Mixolab analysis was conducted to assess the rheological properties of flour, including protein weakening (torque C2) and starch behavior. Dough stability was evaluated based on deformation resistance over time. Data were analyzed using ANOVA and mean differences were assessed via Tukey’s test at p<0.05. Results: Results indicated that particle size decreased as tempering time and temperature decreased. The average particle size of wheat flour samples ranged from 14.05-8.65 µm (D10), 60.00-63.50 µm (D50), 113.50-96.50 µm (D90), 28.75-5.95 µm (D(3,2)) and 61.55-66.50 µm (D(4,3)). Torque C2, an indicator of protein weakening, varied between 0.44 and 0.56 Nm, demonstrating that tempering conditions influenced flour protein properties. The Mixolab analysis showed that starch properties of conditioned wheat resulted in slightly lower rheological performance than standard flour. Dough stability was highest in the control sample, improving deformation resistance by 9.42 min, while wheat conditioned at 60̊C for 12 hrs (T3T2 sample) exhibited the lowest dough stability (6.51 min). Conclusion: Tempering conditions significantly affected flour particle size and thermo-mechanical properties. Lower tempering temperatures and shorter durations resulted in finer flour particle sizes. Additionally, flour from conditioned wheat showed variations in dough stability and protein weakening, with higher tempering temperatures leading to reduced dough stability. Understanding these effects can help optimize tempering conditions for improved flour quality.
| Copyright © 2025 Jemal and Awulachew. This is an open-access article distributed under the Creative Commons Attribution License, which permits unrestricted use, distribution, and reproduction in any medium, provided the original work is properly cited. |
INTRODUCTION
An estimated 733 metric tons of wheat (Triticum aestivum) were produced in 2014-15, making it a significant crop globally1. Three components make up wheat grain: The bran, which is mainly composed of dietary fiber; the germ, which is primarily composed of lipids and proteins; and the endosperm, which is predominantly composed of carbohydrates and proteins. Commercial wheat flour is produced based on its intended use or application. For instance, the chemical makeup, milling process and wheat cultivar of white flour are very different from those of whole wheat flour. The main difference between the two is that whereas whole wheat flour contains bran and germ, white bread flour is entirely made up of endosperm.
The initial step in preparing cereal grains is grinding, which determines if the grist is fit for additional processing. Grain milling is a multi-step operation and the flour business commonly uses roller mills. The intermediate products are categorized after each grinding stage, with flour being separated each time. The flours from each milling and sifting step are combined to make the finished flour product. According to Małgorzata et al., the characteristics of the wheat, the mill’s design and the operating environment all affect the final product’s quality2. Particle size has a significant impact on wheat flour’s functional characteristics. Numerous previous research has shown that particle size significantly affects physicochemical parameters, such as water absorption, solvent retention, sedimentation, damaged starch content, decreasing values and pasting properties. These characteristics then affect the dough’s rheological characteristics, such as water absorption and development time, as well as the end product’s quality3.
Tempering or conditioning enhances extraction by reducing the amount of pericarp particles in flour. Tempering is the process of adding water to grains before milling to soften the endosperm and toughen the bran. Wheat conditions influence final flour quality, grinding energy, milling temperature and bran and endosperm physical properties4. They discovered that, while flour extraction rate declined with increasing kernel moisture, flour quality improved with lower flour ash and polyphenol oxidase activity.
Wheat conditioning research investigates how moisture affects grain physical properties, how quickly water is absorbed and distributed throughout the grain, how moisture affects breakage during roller milling, how conditioning influences human characteristics and performance and how different conditioning regimes are compared and evaluated5. Conditioning methods such as cold, warm and hot tempering, which varied according to the temperature of the water used to condition wheat. At the same time, the amount of water used and the time it takes for it to penetrate the kernel vary greatly in practice and there is no single conditioning regimen that is universally adequate for all wheat kinds and milling techniques. Light wheats are usually conditioned to 15-15.5% moisture, whereas hard wheat’s are conditioned to 16-16.5% Wb. These data make it worthwhile to look into how the particle size and thermomechanical properties of refined wheat flour are affected by different tempering conditions, such as hot tempering up to 60°C and cold tempering at room temperature for 6 to 24 hrs.
The four most popular empirical tests for evaluating the rheological characteristics of wheat dough are the Farinograph, Extensograph, Amylograph and Alveograph tests. Mixolab, a new rheological instrument for characterizing wheat flour, was created recently. By mimicking the steps of the baking process (mixing, heating and cooling), the Mixolab technique can be regarded as an assessment that, in a single test, predicts the final product’s quality to varied degrees6. By measuring the torque of the dough during temperature changes, the Mixolab technique allows determining the amount of water needed for dough development, the time it takes, the strength and weakening of gluten, the gelatinization of starch and the dough’s retrogradation, enzymatic activity and gel resistance7,8. Furthermore, the Mixolab technique has been effectively used to assess various attributes of wheat flour quality6,9-11 and the effect of particle size on reconstituted WG quality attributes12,13. However, little or no research has examined the effects of wheat tempering conditions on flour particle size and thermomechanical characteristics. This study used the Mixolab technology and flour particle size to assess how tempering conditions affected thermomechanical properties.
| Table 1: | Experimental design for the tempering conditions of wheat | |||
| X=Tempering conditions of wheat (Factors) | |||
| Treatment | X1: Temperature (°C) | X1: Time (hrs) | Y: Dependent variables |
| Control | Room temperature | 24 | |
| T1t1 | 20 | 6 | |
| T1t2 | 20 | 12 | |
| T1t3 | 20 | 18 | Particle size |
| T2t1 | 40 | 6 | |
| T2t2 | 40 | 12 | |
| T2t3 | 40 | 18 | |
| T3t1 | 60 | 6 | |
| T3t2 | 60 | 12 | |
| T3t3 | 60 | 18 | |
MATERIALS AND METHODS
Materials: The material was a wheat (Triticum aestivum, Daka variety) kindly provided by Kulumsa Agricultural Research Center, Ethiopia and was harvested between October and November of 2023. Grain was purified before conditioning, which was performed in tightly-sealed plastic bowls and stored in a dry, ventilated place.
Experimental design: This work assesses differences in flour particle size and wheat tempering conditions as a function of two factors: Temperature (20-60°C) and time (6-18 hrs) as shown in Table 1. The experiments were conducted five times each.
Wheat tempering and milling process: To obtain refined flour, the wheat grains were conditioned to 15.5% wet basis moisture with distilled water and after 6, 12 and 20 hrs with the corresponding temperature of 20, 40 and 60°C respectively, before milling to permit the penetration of water to the core of the kernel. The conditioned wheat was milled by roll mill CD1 (Chopin Technologies, France) according to the method No. 26-10.02 of the AACCI6.
Thermomechanical properties (Mixolab analysis): Thermomechanical properties were studied using the Mixolab analyser (Chopin Technologies Inc. Paris, France) and with the application of the Chopin and Mixolab protocol, method 54-60.01 AACCI6. The Mixolab determines a comprehensive qualitative profile of wheat flour in real time, the torque (expressed in Nm) produced by the passage of the dough between two kneading arms when submitted to both shear stress and a temperature constraint. The Mixolab is capable of determining physical dough properties like mixing behaviour, dough strength and stability along with the pasting properties.
The Chopin+ protocol involving a constant mixing speed of 80 rpm was used to assess the dough rheology. During the first stage, commotion of spherical protein particles occurs, leading to the unfolding of proteins and the formation of a three-dimensional network, which has gas retaining properties. In this stage, hydration of flour components also takes place. The parameters that are obtained from the curve are water absorption (%) or the percentage of water required for the dough to produce a torque of 1.1±0.05 Nm, dough development time (min) or the time to reach the maximum torque at 30°C and dough stability (min) or the elapsed time at which the torque produced is kept at 1.1 Nm. The second stage is marked by an increase in dough temperature from 30 to 90°C (8-23 min) and a significant decrease in torque, which is accredited to mechanical weakening (Nm) or thermal destabilization of the protein network. The rise of dough temperature leads to protein denaturation involving the release of a large quantity of water. As the temperature further increases, the protein alterations are shrouded by the properties of starch. Now, the starch molecules absorb water, swell and amylose leaches out in the aqueous phase, resulting in an increase in viscosity as well as torque (stage 3). Thereafter, a constant temperature of 90°C for 7 min is maintained, which allows for the enzymatic action on starch granules demonstrating a reduction in dough viscosity (stage 4). In the last stage, as the temperature decreases from 90 to 50°C over 10 min and then is held for 50°C for 5 min, the torque increases due to retrogradation of starch molecules.
Key parameters derived from the Mixolab curve are water absorption (%), dough development (C1), protein weakening, i.e., decrease in dough consistency due to excessive mixing (C2), starch gelatinisation, i.e. starch granules swell and absorb water and amylose molecules to leach out increasing the viscosity (C3), amylase activity (C4) and starch gelling (C5).
Particle size analysis: Dry method was used for particle size determination. Flour particle size was evaluated using a Mastersizer 3000 (Malvern Instruments, Malvern, UK) and values of Di, which account for the equivalent spherical diameter of the particles, were obtained.
Statistical analysis: The data were statistically analyzed and an analysis of variance performed. The significance of the differences between the means was evaluated with Tukey’s test. The statistical hypotheses were tested at a significance level of p<0.05.
RESULTS AND DISCUSSION
State of wheat kernels before tempering: The physicochemical properties of wheat kernels (Daka cultivar) was examined before tempering are shown in Table 2. One helpful metric for estimating the possible milling yield is the thousand kernel weight. Both the grain yield and the milling yield are directly enhanced by the kernel size. The wheat used in this study weighed 36.19 g per thousand kernels, making it tiny. Very small (15-5 g), small (26-5 g), medium (36-5 g), large (46-4 g) and very large (≥45 g) are the categories into which wheat grains can be divided. Grain diameter and thousand-grain weight are crucial factors in the milling process prediction14. Large grains are undesirable because they can cause production losses by adjusting the cleaning and grinding machinery15.
The current finding for single kernel hardness index (70.25±0.10%) was found extreme values of hardness compared to the previous findings for wheat cultivars (Astoria, Cytra, Radunia and Parabola) before tempering in the range of 53.57-67.252. These should be considered hard wheat.
Since lower as hconcentrations (<1.80%) boost yield in the grinding process, the obtained ash percentage of 1.54% (Table 2) is thought to be excellent for flour manufacturing. High levels of ash cause bran to be extracted from flour more readily, which impairs cooking ability, causes unwanted color changes and disrupts the continuity of gluten networks. The Daka type of wheat had a hectoliter weight of 80 g/hL. In the milling industry, this hectoliter weight is regarded as a crucial quality element. In addition to the amount of foreign matter and broken grains in the sample, its value can also be affected by the uniformity, shape, density and size of the grains.
| Table 2: | Physical characteristics of the kernels of the wheat cultivar (Daka variety) before tempering | |||
| Parameter | Value |
| Hectoliter weight (g/hL) | 80.00±0.00 |
| Moisture content (%) | 10.30±0.06 |
| Ash content (%) | 1.54 |
| Thousand kernel weight (g) | 36.19±0.67 |
| Single kernel diameter (mm) | 2.62±0.05 |
| Single kernel weight (mg/kernel) | 32.03+0.81 |
| Single kernel hardness index (%) | 70.25±0.10 |
| Protein content (%) | 13.83±0.58 |
| Values are mean±SD of determinations made in triplicates | |
| Table 3: | Effect of tempering conditions (time and temperature) of wheat grains on the particle size of flour | |||
| Flour particle size, D (mm) | |||||
| Treatment | D (10) | D (50) | D (90) | D (3,2) | D (4,3) |
| Control | 22.60±0.00bcd | 137.50±6.36b | 285.0±17.0ab | 50.35±0.07cd | 145.50±7.78ab |
| T1t1 | 23.45±0.07bc | 137.50±4.95b | 254.00±8.49bcd | 51.55±0.07bc | 138.00±4.24bc |
| T1t2 | 14.05±0.92e | 60.00±5.37d | 113.50±12.02f | 28.75±1.91e | 61.55±6.01e |
| T1t3 | 27.85±0.92a | 163.50±7.78a | 296.50±7.78a | 64.45±2.19a | 166.50±6.36a |
| T2t1 | 24.60±0.28b | 143.50±6.36ab | 264.50±9.19abc | 55.60±0.85b | 145.00±5.66abc |
| T2t2 | 28.65±0.92a | 162.00±8.49a | 287.50±13.44ab | 65.95±2.33a | 164.00±8.49a |
| T2t3 | 21.50±0.28cd | 110.50±0.71c | 220.00±2.83de | 46.20±0.57d | 115.50±0.71d |
| T3t1 | 21.25±0.50d | 110.50±0.71c | 213.00±2.83e | 46.15±1.06d | 113.50±0.71d |
| T3t2 | 23.25±0.21bcd | 126.50±4.95bc | 244.50±12.02cde | 52.20±0.28bc | 131.50±4.95bcd |
| T3t3 | 24.00±0.00b | 122.00±4.24bc | 226.00±5.66cde | 51.85±0.21bc | 123.50±3.54cd |
| Minimum | 14.05 | 60 | 113.5 | 28.75 | 61.55 |
| Maximum | 28.65 | 163.5 | 296.5 | 65.95 | 166.5 |
| Note: D [10, 50, 90, (3, 2) and (4, 3)] mm: average particle size which constitutes the bulk of the sample volume. The values are mean±SD of determinations made in triplicates. Values followed by different superscripts are significantly different at p<0.05 | |||||
Effect of tempering condition on the refined wheat flour particle size distribution: Each treatment had different particle sizes at their respective mean, D10, D50, D90, D3, 2 and D4, 3 values (Table 3). There are significant differences between those D [10, 50, 90, (3, 2) and (4, 3)] of flour at p<0.05. Though the flours’ particle sizes D [10, 50, 90, (3, 2) and (4, 3)] decrease as the grain’s tempering time and temperature drop, this is in accordance with the results shown in Table 3. While T1t2 had smaller particles at their respective mean, D10, T2t2 had larger particles on average and a higher proportion of large particles. Different pretreatment or tempering conditions (temperature and time) may be the cause of these variations.
The size of the flour particles has a significant impact on the final product, dough stability during mixing, solvent retention and water absorption16. The composition and starch damage of flour may differ depending on the distribution of particle sizes. Three categories of flour particle classes were identified: less than 17 μm (mostly wedge protein), 17-40 μm (mainly starch) and more than 40 μm (starch plus protein). Grain type, mill type, milling condition and grain moisture all have an impact on the particle size distribution overall15.
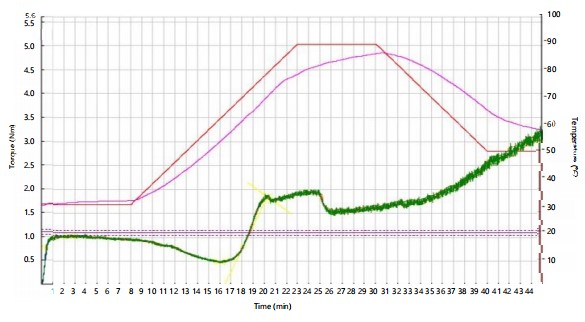
Effect of tempering condition on the refined wheat flour Mixolab profile: The Mixolab curves for wheat flour samples are presented in Figure 1-2 to illustrate the nature of the curves obtained.
The strength of each sample could be adjudged from the Mixolab data based on dough development time, dough stability and C2. Significant differences were noted in dough development time and dough stability of flours. The development time is related to the time necessary to hydrate all the compounds, which mainly depends on the tempering condition of wheat. The findings presented in Table 4 indicated that the dough stability of different tempering conditions of wheat samples was in the range of 6.51 to 9.42 min. It can be seen from the data that the wheat sample of the control had the higher dough stability, which improved the deformation resistance of dough by about 9.42 min, while the T3T2 sample had the lowest dough stability (6.51 min). In this regard, the control sample achieved the longest resistance of the dough against mixing. The current studied result is alien to the previous studies for the stability data of wheat ranged between 4.4-11.2 min7,16.
Torque C2, as an indicator of protein weakening and it represents the minimum torque attained when the dough undergoes mixing as well as heating, was affected by the tempering condition of wheat grain and found in the range of 0.44 to 0.56 Nm. This was the consequence of dilution of wheat gluten complex to form dough with similar physical characteristics (protein compositions) due to the different tempering conditions of these flours. The factors of tempering condition were significant for slope α and the speed of protein weakening and/or decrease in dough consistency, which was lower in T1t2 (-0.094 Nm/min). According to the Lacko et al.16, good quality proteins are represented by C2 in the range of 0.5-0.6 Nm. It signifies the quality and stability of wheat protein network to thermal weakening with lower values showing poor gluten quality. In a study reported by, differences in dough development time between excellent bread making quality wheat and moderately good bread making quality wheat were attributed to differences in the proportion of glutenin17. The differences in the Mixolab parameters implied a significant variation among flour samples in terms of dough strength and gluten quality.
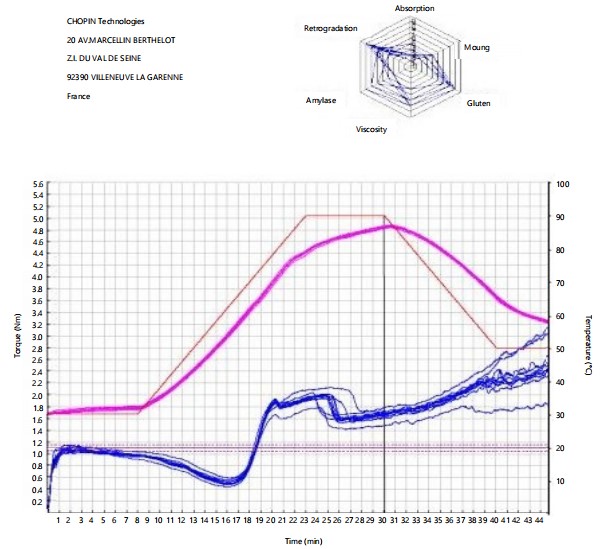
|
|
| Table 4: | Impact of tempering condition on the particle size on the Mixolab parameters of refined flour | |||
| Treatment | ||||||||||
| Mixolab properties | Control | T1t1 | T1t2 | T1t3 | T2t1 | T2t2 | T2t3 | T3t1 | T3t2 | T3t3 |
| Water absorption (%) | 53.70±0.14d | 57.55±0.07a | 56.15±0.07ab | 56.73±1.46a | 56.13±0.04abc | 56.33±0.04ab | 54.85±0.08bcd | 56.12±0.03abc | 54.44±0.05cd | 56.12±0.02abc |
| Moisture content (%) | 12.31±0.01g | 14.72±0.02a | 14.52±0.03b | 13.51±0.01e | 14.71±0.01a | 14.52±0.02b | 14.02±0.03d | 14.51±0.01b | 13.12±0.02f | 14.23±0.04c |
| Amplitude (Nm) | 0.04±0.02a | 0.03±0.01a | 0.05±0.00a | 0.03±0.00a | 0.04 0.01a | 0.03±0.01a | 0.05±0.01a | 0.03±0.03a | 0.04±0.02a | 0.5±0.311a |
| Dough stability (min) | 9.42±0.02a | 8.22±0.03e | 6.82±0.02h | 8.42±0.02d | 8.50±0.00c | 8.00±0.03g | 8.12±0.02f | 6.51±0.01i | 9.41±0.01a | 9.23±0.04b |
| Torque (Nm) | ||||||||||
| C1 | 1.03±0.00h | 1.09±0.03c | 1.15±0.03a | 1.06±0.00f | 1.07±0.01d | 1.09±0.00b | 1.09±0.02b | 1.06±0.00e | 1.05±0.01g | 1.06±0.00e |
| CS | 0.96±0.01e | 0.97±0.02c | 0.99±0.01a | 0.97±0.01d | 0.97±0.01d | 0.98±0.02c | 0.99±0.02b | 0.91±0.02f | 0.97±0.02c | 0.98±0.01c |
| C2 | 0.49±0.01de | 0.49±0.02de | 0.56±0.01a | 0.49±0.00e | 0.53±0.01b | 0.49±0.01d | 0.53±0.01b | 0.44±0.01f | 0.54±0.02b | 0.51±0.02c |
| C3 | 1.86±0.01f | 1.916±0.01b | 1.934±0.0a | 1.89±0.00c | 1.89±0.01c | 1.87±0.00e | 1.88±0.00d | 1.68±0.01g | 1.917±0.00b | 1.86±0.00ef |
| C4 | 1.77±0.01e | 1.86±0.01a | 1.86±0.00a | 1.82±0.01bc | 1.81±0.01c | 1.78±0.02d | 1.81±0.00bc | 1.59±0.01f | 1.83±0.02b | 1.76±0.01e |
| C5 | 2.99±0.01a | 2.35±0.01e | 2.95±0.01b | 2.42±0.00d | 2.33±0.00f | 2.42±0.02d | 2.56±0.01c | 1.76±0.00h | 2.34±0.02f | 2.22±0.01g |
| α (Nm/min) | -0.088 | -0.042 | -0.094 | -0.052 | -0.044 | -0.034 | -0.078 | -0.056 | -0.06 | -0.066 |
| β (Nm/min) | 0.478 | 0.57 | 0.44 | 0.548 | 0.474 | 0.538 | 0.454 | 0.532 | 0.476 | 0.496 |
| γ (Nm/min) | -0.166 | -0.118 | -0.148 | -0.148 | -0.168 | -0,162 | -0.136 | -0.154 | -0.174 | -0.192 |
| *WA: Water absorption, the amount of water required in dough development, DDT: Dough development time, STB: Stability, time of dough stability at constant temperature, C2: Protein weakening, C3: Starch gelatinization, C4: Starch gel stability (amylase activity), C5: Starch gelling (starch retrogradation in the cooling phase) α: Protein network weakening rang, β: Starch gelatinization rang and γ: cooking stability range | ||||||||||
Starch characteristics measured by Mixolab, such as gelatinisation (C3), amylolytic activity (C4) and starch retrogradation (C5) were significant for all experimental factors. Torque C3 was higher for treatment T1t2 (1.934 Nm), indicating higher starch gelatinisation and higher dough viscosity. Slope β (gelatinisation speed) was significantly lower for T1t2 (0.44 Nm/min), confirming the slower gelatinisation process. Heat stability of the starch gel at temperature over 80 °C, when consistency decreases as a result of amylolytic activity17, phase C4, was significantly lower for T3t3 (1.76 Nm) and control (1.77 Nm), tempering condition influences this parameter. T1t1 and T1t2 were characterized with higher hot starch paste stability (torque C4) and very low α-amylase degradation speed. Torque C5, as the measure of starch retrogradation in the dough during the cooling phase, was significantly higher for control wheat (2.99 Nm). For the standard sample of wheat flour, reported strong torque C2, C3, C4, C5 values of 0.60, 1.98, 1.90 and 2.97 Nm, respectively18.
Starch properties of various sets of conditioned wheat, demonstrated Mixolab rheological behaviour of flour slightly lower than the standard flour. Podolska et al.19 reported an important influence of the share of cereals in crop rotation on the grain and dough quality, with a decrease of alveograph value "W" with an increased share of cereals19. On other studies, Babulicová and Gavurníková20 found higher wet gluten content and gluten index in crop rotations with a lower share of cereals. Moreover, the dough elasticity expressed by the values of amplitude (Nm) was higher for the wheat flour (T1t2, T2t3 and T3t3) in comparison to the control wheat flour. The maximum elasticity for wheat dough was 0.05, while the minimum was 0.03 (Table 4).
CONCLUSION
The time and temperature constraints have important implications on particle size and mixolab properties of wheat, presenting different technological qualities. These characteristics may impact the functionality, sensory acceptability, nutritional properties, and shelf life of wheat flour. The presented study provides a better understanding of the wheat tempering condition on particle size and thermomechanical properties of flour. The particle size of the flours, D [10, 50, 90, (3, 2) and (4, 3)] decreases when the time and temperature of the grain decrease during tempering. The particle size distribution may be influenced by grain type, grain moisture, mill type, and milling condition. A deeper comprehension of the usefulness of refined wheat with the behavior of the protein characteristics is made possible by the Mixolab apparatus. However, the amount of water present in the formed mass system affects the starch's characteristics, including its degree of gelatinization, gel stability, and retrogradation. The quality of the gluten network is generally associated with the torque, C2, which is the protein's quality, and the variations in refined wheat particle sizes concerning stability and development time. Gelatinization (C3), amylolytic activity (C4), and starch retrogradation (C5), all of which were assessed by Mixolab were significant for every experimental factor.
SIGNIFICANCE STATEMENT
This study offers valuable insights into how tempering conditions, specifically temperature and time, affect the rheological properties and particle size distribution of wheat flour, which are essential for optimizing milling and baking processes. By examining the relationship between tempering conditions and flour properties, the research enhances our understanding of how water absorption and milling conditions influence texture, protein characteristics and dough behavior. Utilizing Mixolab analysis, this study provides a detailed view of flour’s functional performance, crucial for the baking industry. The findings can lead to more precise tempering strategies, improved flour quality and optimized product development. Additionally, this research supports global food innovation by promoting healthier, more efficient food production and sustainable milling practices.
ACKNOWLEDGMENT
The authors are grateful to Asella Malt Factory for using the thermometer measuring equipment during conditioning of wheat.
REFERENCES
- Ahmed, J., M.Z. Mulla and Y.A. Arfat, 2017. Particle size, rheological and structural properties of whole wheat flour doughs as treated by high pressure. Int. J. Food Prop., 20: 1829-1842.
- Warechowska, M., A. Markowska, J. Warechowski, A. Miś and A. Nawrocka, 2016. Effect of tempering moisture of wheat on grinding energy, middlings and flour size distribution, and gluten and dough mixing properties. J. Cereal Sci., 69: 306-312.
- Pang, J., E. Guan, Y. Yang, M. Li and K. Bian, 2021. Effects of wheat flour particle size on flour physicochemical properties and steamed bread quality. Food Sci. Nutr., 9: 4691-4700.
- Kweon, M., R. Martin and E. Souza, 2009. Effect of tempering conditions on milling performance and flour functionality. Cereal Chem., 86: 12-17.
- Fang, C. and G.M. Campbell, 2003. On predicting roller milling performance V: Effect of moisture content on the particle size distribution from first break milling of wheat. J. Cereal Sci., 37: 31-41.
- Bressiani, J., T. Oro, P.M.L. da Silva, F.M. Montenegro, T.E. Bertolin, L.C. Gutkoski and M.A. Gularte, 2019. Influence of milling whole wheat grains and particle size on thermo-mechanical properties of flour using Mixolab. Czech J. Food Sci., 37: 276-284.
- Dubat, A., 2010. A new AACC international approved method to measure rheological properties of a dough sample. Cereal Foods World, 55: 150-153.
- Švec, I. and M. Hrušková, 2015. The Mixolab parameters of composite wheat/hemp flour and their relation to quality features. LWT Food Sci. Technol., 60: 623-629.
- Codină, G.G., S. Mironeasa, D. Bordei and A. Leahu, 2010. Mixolab versus alveograph and falling number. Czech J. Food Sci., 28: 185-191.
- Banu, I., G. Stoenescu, V. Ionescu and I. Aprodu, 2011. Estimation of the baking quality of wheat flours based on rheological parameters of the mixolab curve. Czech J. Food Sci., 29: 35-44.
- Papoušková, L., I. Capouchová, M. Kostelanská, A. Škeříková and E. Prokinová et al., 2011. Changes in baking quality of winter wheat with different intensity of Fusarium spp. contamination detected by means of new rheological system. Czech J. Food Sci., 29: 420-429.
- Liu, T., G.G. Hou, B. Lee, L. Marquart and A. Dubat, 2016. Effects of particle size on the quality attributes of reconstituted whole-wheat flour and tortillas made from it. J. Cereal Sci., 71: 145-152.
- Wang, N., G.G. Hou and A. Dubat, 2017. Effects of flour particle size on the quality attributes of reconstituted whole-wheat flour and Chinese Southern-type steamed bread. LWT Food Sci. Technol., 82: 147-153.
- Rad, M.R.N., H.Z.E. Jaafar, H.A. Moghaddam, O. Poodineh and H. Moayedi, 2010. Relation between physiological and some agronomic characteristics in selected genotypes of wheat in drought stress condition. J. Food Agric. Environ., 8: 891-893.
- Posner, E.S., 2009. Wheat Flour Milling. In: Wheat: Chemistry and Technology, Khan, K. (Ed.), AACC International, Inc., ISBN: 978-1-891127-55-7, pp: 119-152.
- Lacko-Bartošová, M., L. Lacko-Bartošová and P. Konvalina, 2021. Wheat rheological and Mixolab quality in relation to cropping systems and plant nutrition sources. Czech J. Food Sci., 39: 265-272.
- Baasandorj, T., J.B. Ohm and S. Simsek, 2020. Comparison of different experimental breadmaking methods and their associations with flour quality parameters in hard red spring wheat. Cereal Chem., 97: 515-526.
- Schmiele, M., M.H.F. Felisberto, M.T.P.S. Clerici and Y.K. Chang, 2017. Mixolab™ for rheological evaluation of wheat flour partially replaced by soy protein hydrolysate and fructooligosaccharides for bread production. LWT Food Sci. Technol., 76: 259-269.
- Podolska, G., E. Aleksandrowicz and A. Szafrańska, 2020. Bread making potential of Triticum aestivum and Triticum spelta species. Open Life Sci., 15: 30-40.
- >Babulicová, M. and S. Gavurníková, 2015. The influence of cereal share in crop rotations on the grain yield and quality of winter wheat. Agric. (Pol'nohospodárstvo), 61: 12-21.
How to Cite this paper?
APA-7 Style
Jemal,
N.D., Awulachew,
M.T. (2025). Impact of Wheat Tempering Conditions on Flour Particle Size and Thermo-Mechanical Properties. Asian Journal of Biological Sciences, 18(3), 669-678. https://doi.org/10.3923/ajbs.2025.669.678
ACS Style
Jemal,
N.D.; Awulachew,
M.T. Impact of Wheat Tempering Conditions on Flour Particle Size and Thermo-Mechanical Properties. Asian J. Biol. Sci 2025, 18, 669-678. https://doi.org/10.3923/ajbs.2025.669.678
AMA Style
Jemal
ND, Awulachew
MT. Impact of Wheat Tempering Conditions on Flour Particle Size and Thermo-Mechanical Properties. Asian Journal of Biological Sciences. 2025; 18(3): 669-678. https://doi.org/10.3923/ajbs.2025.669.678
Chicago/Turabian Style
Jemal, Neima, Demssis, and Melaku Tafese Awulachew.
2025. "Impact of Wheat Tempering Conditions on Flour Particle Size and Thermo-Mechanical Properties" Asian Journal of Biological Sciences 18, no. 3: 669-678. https://doi.org/10.3923/ajbs.2025.669.678

This work is licensed under a Creative Commons Attribution 4.0 International License.