Anaerobic Digestion of Cow Dung for Biogas Production in Kara Market, Sokoto, Nigeria
-
Abdulkadir Shehu


Department of Biological Sciences, Faculty of Science, Sokoto State University, Sokoto
Hassan Muhammad MaishanuDepartment of Plant Science, Faculty of Chemical and Life Sciences, Usmanu Danfodiyo University, Sokoto
Sabi’u Muhammad YelwaDepartment of Zoology, Faculty of Chemical and Life Sciences, Usmanu Danfodiyo University, Sokoto
Aliyu Sarkin BakiDepartment of Microbiology, Faculty of Chemical and Life Sciences, Usmanu Danfodiyo University, Sokoto
| Received 01 Mar, 2025 |
Accepted 30 May, 2025 |
Published 30 Sep, 2025 |
Background and Objective: The increasing demand for renewable energy sources highlights the need for optimizing biogas production. This study investigates the potential of cow dung as a substrate for biogas generation, focusing on the influence of temperature and pH variations on yield. Additionally, key bacterial species involved in the anaerobic digestion process are identified to better understand microbial contributions. Materials and Methods: Anaerobic digestion was conducted using cow dung over 7 weeks/retention periods using the water displacement method, while temperature and pH variations were monitored throughout the study. Bacterial species were isolated and characterized using standard microbiological techniques. Statistical analysis was performed using One-way ANOVA to determine significant differences in biogas production across retention periods, with a significance level set at p<0.05. Results: The highest biogas yield was recorded at 28 days (3223.33±1377.47 mL) at a peak temperature of 36.5±1.5°C, followed by 21 days (2360.00±183.58 mL) at 34.0±1.0°C and 14 days (863.33±100.17 mL) at 31.0±1.0°C. The lowest yield was observed at 42 days (70.00±20.00 mL) at 26.2±1.5°C. The pH analysis revealed a decrease from initial values (7.85±0.211 at 35 days) to lower post-digestion levels, with the lowest pH observed at 28 days (5.59±0.003). The bacterial analysis identified were Bacillus subtilis, Salmonella sp., Escherichia coli, Clostridium sp., Corynebacterium sp., Pseudomonas aeruginosa, and Bacillus cereus. The most predominant species was Bacillus subtilis (29.17%), followed by Bacillus cereus (20.83%) and Escherichia coli (16.67%), while Clostridium sp., had the lowest occurrence (4.16%). Conclusion: The study confirms that biogas yield and temperature trends peak at 28 days, with significant microbial contributions. Future research should explore co-digestion strategies, enhanced temperature regulation, and microbial inoculation to further optimize biogas yield.
| Copyright © 2025 Shehu et al. This is an open-access article distributed under the Creative Commons Attribution License, which permits unrestricted use, distribution, and reproduction in any medium, provided the original work is properly cited. |
INTRODUCTION
Biogas is a combustible, colorless gas generated through the anaerobic digestion of organic materials, including animal, plant, human, industrial, and municipal waste. This biological fermentation process primarily yields methane (50-70%) and carbon dioxide (30-50%), with minor concentrations of other gases such as nitrogen, hydrogen, ammonia, hydrogen sulfide, and water vapor (each constituting less than 1%)1. Biogas can be produced from any biodegradable feedstock that is suitable for anaerobic digestion2. Production of biogas through anaerobic digestion (AD) of animal manure and slurries, as well as a wide range of digestible organic wastes, converts these substrates into renewable energy. Anaerobic digestion (AD) technology is well established; hence, biogas is often categorized as a ‘first-generation’ biofuel that has developed from a method for waste treatment to a process aiming at methane production as an energy carrier3,4. Renewable natural gas (RNG) serves as a sustainable, carbon-neutral alternative to fossil-derived natural gas, offering a clean and controllable energy source derived from organic waste materials. Among the available production methods, anaerobic digestion is the most widely utilized and technologically advanced process. This method relies on a low-oxygen environment, enabling the microbial decomposition of organic matter by naturally occurring bacteria5.
The biogas production process consists of four key stages: Hydrolysis, acidogenesis, acetogenesis, and methanogenesis6. During hydrolysis, complex macromolecules such as carbohydrates, fats, and proteins are enzymatically broken down into their monomeric components by microbial activity, primarily involving Bacteroides, Clostridia, and facultative bacteria such as Streptococci. In the subsequent acidogenesis phase, these monomers undergo further degradation into short-chain fatty acids, including acetic, propionic, butyric, and carbonic acids, along with alcohols, hydrogen, and carbon dioxide. Acetogenesis then facilitates the conversion of these short-chain acids into acetate, hydrogen, and carbon dioxide. Finally, during methanogenesis, methanogenic archaea metabolize these intermediates, producing methane and carbon dioxide. Notably, approximately one-third of methane generation results from the reduction of carbon dioxide by hydrogen7.
Several factors influence biogas production, including digester conditions, pH, nutrient availability, temperature, the carbon-to-nitrogen (C/N) ratio, and the presence of a starter culture³. Maintaining a stable and dynamic equilibrium within the anaerobic digester is essential for optimal microbial activity. The pH should be maintained within the range of 6.6 to 7.6, as methanogenic bacteria function most efficiently within this interval8. Adequate concentrations of essential nutrients, such as nitrogen and phosphorus, must be supplied to support bacterial growth2. Temperature is another critical factor, with mesophilic bacteria requiring an optimal range of 30-38°C, while thermophilic bacteria thrive at higher temperatures between 49-57°C. The ideal C/N ratio for efficient biogas production falls between 25 and 30. Additionally, the use of a starter culture significantly enhances the degradation of organic matter, with activated sludge and rumen fluid being among the most commonly employed inoculants5.
The primary challenge in the modern world is to harness an energy source that is both environmental friendly and economically viable. This need has forced researchers to explore alternative energy sources. Unfortunately, alternative sources such as solar, hydro, and wind energy require significant financial investment and technical expertise, making them difficult to implement in developing countries like Nigeria9. Energy consumption in Nigeria has been increasing at a high rate. On a global scale, the Nigerian energy industry is considered one of the most inefficient in meeting consumer needs. This inefficiency is most evident in the persistent disequilibrium in the markets for electricity and petroleum products10. The poor energy service provision has adversely affected living standards and worsened both income and energy poverty, particularly in an economy where the majority of the population lives on less than $2 a day11.
The development of biogas technology presents a viable alternative energy source that is both affordable and environmentally sustainable. It can help preserve forests and contribute to achieving the 7th mandate of the Millennium Development Goals on environmental sustainability3. In addition to addressing the urgent need for waste treatment to maintain a clean environment, anaerobic digestion offers potential value recovery from organic waste (i.e., “waste to wealth”) through biogas production12. Furthermore, millions of tons of waste released daily emit significant amounts of methane when exposed to the atmosphere, a gas 320 times more harmful to human health than carbon dioxide13.
This study aims to investigate biogas production from cow dung and assess the effects of temperature variation, pH changes, and biochemical characterization of bacteria involved.
MATERIALS AND METHODS
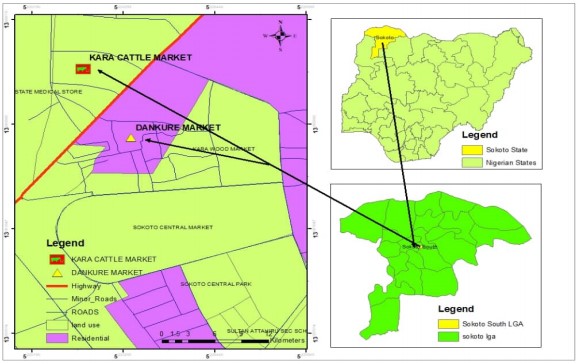
Study area: Sokoto is a city located in the extreme Northwest of Nigeria, near the confluence of the Sokoto River and the Rima River. The Sokoto River, formerly known as Gulbin Kebbi, is a river in Northwestern Nigeria and a tributary of the River Niger. The river source is near Funtua in the South of Katsina State, some 275 km in length14. Sokoto lies between Latitudes 12°45'N and 13°35'N and Longitudes 4°55'E and 6°00'E15. It is bordered to the North by Gada Local Government Area, to the South by Dange Shuni, to the East by Sabon Birni and Isa Local Government Areas, and to the West by Tangaza and Binji14. Sokoto metropolis comprises three major local government council areas: Sokoto North, Sokoto South, and Wamakko. Sokoto occupies 25,973 km2 with a population of 563,86116. The people in the study area are mainly Hausa and Fulani Fig. 1.
The area lies in the Sudan-Sahelian Ecological Zone, which is semi-arid. It is characterized by three seasons: Cool and dry, hot and dry, and hot and wet16. The area is influenced by the tropical continental air mass (cT) from November to February. The cT is a South-moving cold air mass associated with cool, dry, and dusty winds17. This period is referred to as the Harmattan season. Temperature during this period could be as low as 22°C or below. The hot season occurs from March to May, with high temperatures reaching 38-45°C and an annual rainfall of 500-800 mm18. The state records temperatures as high as 45°C, with intense rainfall between July and September, which can lead to flash floods in the study area18.
The vegetation consists mostly of short feathery grasses and scattered trees, most of which are deciduous, characterized by thorny species and scattered Acacia species16. The tree species adapt to dry conditions and are fire-resistant, while the soils in the study area are sandy topsoil and clay.
The land-use types in the study area include built-up areas, farmlands, bare surfaces, vegetation, and water bodies16. The people live in mud houses and very few brick houses, with tarred and untarred roads linking settlements. The built-up environment is characterized by residential, agricultural, academic, commercial, religious, and open spaces, among others19.
Sample collection: Fresh samples of cow dung were collected from the Kara market, Sokoto in a clean polyethylene. The samples were transported within 24 hrs of collection to the Energy Research Centre, Usmanu Danfodiyo University Sokoto for laboratory analysis.
Sample preparation: The fresh sample of the cow dungs was air dried under the sun, after which is dried in an oven at105°C. The samples were dried further at room temperature for a period of 2 weeks before being ground into powdered form using a pestle and mortar20.
Experimental design: A biogas plant was set up comprising of three tins of 400 g capacity as biogas digesters. A hole was made at the center of the lid of each of the three tins and a hose pipe (1 inch) was connected to the hole of each digester and covered with epoxy steel gum to avoid leaking of the gas. The pipe conveyed the gas from the digester to a measuring cylinder (1000 cm3 capacity) filled with water and placed in an inverted position in a basin filled with water (water displacement method). The cylinder was held firm by a retort stand. The gas produced from the digesters was conveyed through the hose pipe to the measuring cylinder which displaced the water downward. The volume of gas produced was measured by the amount of water being displaced from the measuring cylinder. Daily production temperature was recorded at 12:00 noon throughout the retention period of 7 weeks21.
|
Slurry preparation: One hundred grams of cow dungs were weighed using digital weighing scale (Ohaus Adventure Pro; AV 4101 Model) and poured into three empty tin of 400 g capacity serving as digester, which was followed by the addition of 600 mL to give (1:6 substrates to water ratio) of water in each digester. The mixtures were all stirred with a rod and continued to stir for 5 min, until it’s diluted to obtain homogeneity. All the digesters were sealed with a candle wax/epoxy gum (4 min) to block leakages to maintain anaerobic condition21.
Determination of pH: The pH values of substrates were determined before and after digestion for every week using a digital pH meter (HANNA HI 8314). The process begins with preparing a small sample of slurry by mixing the organic feedstock (cow dung) with water, which is collected and placed in a clean beaker22. The pH meter is calibrated using buffer solutions and the pH of the slurry is then measured by immersing the pH electrode inside the digester and carefully observing the value23. The electrodes were thoroughly cleaned with distilled water after every measurement before going to the next substrates22,23.
Determination of temperature: To monitor the temperature, a wall-mounted thermometer (Taylor Precision Products 5329 Indoor/Outdoor Thermometer) is installed near the biogas digester. The wall-mounted thermometer is first calibrated to ensure accurate temperature readings. At 12:00 PM, the ambient temperature is recorded for the period of retention time24. After each daily reading, the thermometer is reset to capture the next 24 hrs cycle of temperature variation25. The collected data is then analyzed to evaluate the correlation between ambient temperature and biogas yield.
Bacteriological analysis: After 7 weeks of anaerobic digestion, the digested substrates (post-biogas production) are prepared for bacteriological analysis. The digester, which is typically equipped with a hose pipe to facilitate the release of biogas, is securely sealed after the completion of the anaerobic digestion process26. The sealed container or sample is then transported to the laboratory under refrigerated conditions (4°C) thereby preserving the integrity of the sample for accurate microbial analysis. All the samples were transported within 24 hrs to the Biology Laboratory, Sokoto State University, Sokoto for analysis.
Media preparation: About 28 g of nutrient agar powder was weighed using a digital analytical balance according to the manufacturer’s instructions. The powder was dissolved in 1 L of distilled water in a conical flask. After the powder was added to water, the flask was gently swirled to begin dissolving the medium. To ensure complete dissolution, a mild heat was applied using a heating mantle to prevent clumping27. The flask containing the dissolved medium was covered with a cotton wool and wrapped with an aluminium foil to prevent contamination. It was then autoclaved at 121°C for 15-20 min27. After autoclaving, the nutrient agar was allowed to cool to around 40-45°C. Then, the agar was poured into sterile petri dishes in a laminar flow hood or aseptic environment to maintain sterility enough to cover the base of the dish, typically around 20-25 mL per dish28. Plates were placed in an incubating chamber to prevent contamination.
Inoculation: An inoculating wire loop or sterile swab was used to transfer the bacterial sample to the media. The inoculating wire loop was sterilized by heating it in a flame until it glows red and allowed to cool for a few seconds to avoid killing the bacteria on contact28,29. The inoculating wire loop was carefully dip into the sample to pick up small portion, then gently introduce it onto the nutrient agar surface using a streak plate method, by rubbing at one edge of the plate and streak across the agar in a zig-zag pattern and by rotating the plate and streak in different directions to ensure even distribution of the bacteria across the media29.
Incubation: The inoculated petri dishes were sealed with parafilm and placed in an incubation chamber to minimize contamination risks and evaporation. Parafilm wrapping was applied around the edges of each plate to secure the lid and prevent leaks during incubation29. The inoculated petri dishes were incubated at 37°C for 24 hrs to allow it to grow27. Plates are placed upside-down (agar side up) to prevent condensation from forming on the agar surface. After incubation, the grown colonies were observed29.
Isolation of pure culture: After the 24 hrs incubation period, the petri dishes were removed from the incubator, and the bacterial colonies were examined and recorded. Each plate was observed for distinct characteristics of the bacterial colonies, including colony size, shape, edge (margin), elevation, color, and opacity30. Individual colonies with distinct morphological characteristics were identified and selected. Using an inoculating loop, a single, well-isolated colony was carefully picked from the agar plate to minimize contamination from neighboring colonies30. The colony morphology was checked, and few appeared to be pure, and others were mixed colonies. Further sub-culturing was performed until a pure culture was achieved31.
Sub-culturing: The selected colony was transferred to a new, sterile agar plate. The inoculation loop was used to streak the bacteria across the plate in a zig-zag pattern to support the growth of isolated colonies29. The streaked plates were incubated at 37°C for 24 hrs. After this incubation period, plates were observed again and a single colony type was grown, confirming a pure culture32.
Gram staining: The Gram staining procedure is a differential staining technique used to classify bacteria into Gram-positive or Gram-negative categories based on cell wall structure.
A small drop of normal saline was first placed on a clean glass slide. Using a sterile inoculating wire loop, a small amount of bacterial culture was carefully transferred from the agar plate into the normal saline. The bacteria were then smeared with the water to create a thin smear across the slide surface32. After creating the smear, the slide was heat-fixed to about 3-4 times by passing the slide through a flame to prevent motile bacteria from moving away, allowed to air dry, which prevents them from washing away during the staining process29.
The slide is flooded with crystal violet to cover the smear, left for 30-60 sec, and then rinsed off with distilled water. This initial dye stained both Gram-positive and Gram-negative bacteria, appearing purple color28. Lugol’s iodine solution was applied to the smear for 30-60 sec to act as a mordant. This reagent formed a crystal violet-iodine complex within the bacterial cells, intensifying the stain in Gram-positive bacteria due to their thicker cell walls. The slide was then rinsed gently with distilled water29. A decolorizing agent, typically acetone, was used to wash the slide for a few seconds, differentiating the bacteria by cell wall type. Gram-positive bacteria retained the purple complex, while Gram-negative bacteria lost the color due to their thinner cell walls. The slide was rinsed with water to stop decolorization immediately30. Finally, safranin was applied for 30-60 sec and then rinsed off. Safranin stains the now colorless Gram-negative bacteria pink or red, contrasting with the purple Gram-positive cells, which retain the primary stain. Afterward, the slide was gently rinsed with distilled water and allowed to dry28,29.
Microscopic identification: The prepared slide was placed on the microscope stage, and immersion oil was added directly onto the stained area to enhance clarity and resolution at high magnification. A 100x oil immersion objective lens, the slide was carefully brought into focus by adjusting the coarse and fine focus knobs to view individual bacterial cells clearly30. Observations were then made regarding cell shape (e.g., cocci, bacilli), arrangement (e.g., chains, clusters), and Gram reaction, where Gram-positive bacteria appeared purple and Gram-negative bacteria appeared pink due to the differential staining process29.
Biochemical characterization
Determination of catalase test: Detects the production of catalase enzyme by bacteria, indicated by bubbling upon the addition of hydrogen peroxide29. A sterilized wire inoculating loop was used to transfer bacterial colonies onto a clean glass slide containing a few drops of hydrogen peroxide29. The reaction was observed immediately for bubble formation, which signifies a positive catalase reaction, and the absence of bubbles indicated a negative result, suggesting the lack of catalase enzyme30.
Determination of oxidase test: Bacterial colonies were cultured on agar plates and incubated at 37°C for 24 hrs to allow sufficient growth. A sterile filter paper was placed on a clean Petri dish and soaked with oxidase reagent. Using a sterile inoculating loop, a bacterial sample was smeared onto the reagent-soaked filter paper30. The reaction was observed for 10-30 sec, with color change serving as an indicator of oxidase activity. A positive result was identified by the appearance of a dark blue or purple coloration, signifying the presence of cytochrome c oxidase, while a negative result showed no color change30.
Determination of citrate: The citrate test was conducted to determine whether bacterial species could utilize citrate as their sole carbon source, aiding in the differentiation of Enterobacteriaceae members28. A citrate medium was prepared by dissolving sodium citrate (2.0 g), ammonium dihydrogen phosphate (1.0 g), dipotassium phosphate (0.2 g), magnesium sulfate (0.1 g), and sodium chloride (0.5 g) in 1000 mL of distilled water29. Bromothymol blue (0.08 g) was added as a pH indicator, and the solution was adjusted to pH 7.0 before incorporating 15.0 g of Simmons’ citrate agar. The medium was sterilized by autoclaving at 121°C for 15 min29.
The sterile citrate agar was poured into test tubes and allowed to solidify in a slant position. A sterile wire loop was used to streak a bacterial colony onto the slant, ensuring even inoculation. The tubes were incubated at 37°C for 24-48 hrs29. Following incubation, color changes were observed. A positive result, indicating citrate utilization, was marked by a shift from green to blue due to an increase in pH. A negative result, with no color change, confirmed the bacterium’s inability to utilize citrate29.
Determination of indole: The indole test determines a bacterium’s ability to produce indole from tryptophan metabolism via the enzyme tryptophanase28. Tryptone broth was prepared by dissolving 10 g of tryptone and 5 g of sodium chloride in 800 mL of distilled water. The solution was adjusted to pH 7.0 using 1N HCl or NaOH, then brought to a final volume of 1 L29. The broth was dispensed into test tubes (5 mL per tube), sealed, and sterilized by autoclaving at 121°C for 15 min29. After cooling, the broth was inoculated with a pure bacterial culture using a sterile wire loop. The inoculated tubes, including positive and negative controls, were incubated at 37°C for 24 hrs30. Following incubation, 3-4 drops of Kovac’s reagent (containing 4-dimethylaminobenzaldehyde, isoamyl alcohol, and concentrated HCl) were added without shaking. A red or pink color in the organic layer indicated a positive result for indole production, whereas a yellow or unchanged layer indicated a negative result29.
Determination of triple sugar iron (TSI) test: The test was conducted using TSI agar, which consists of glucose, lactose, sucrose, ferrous sulfate, sodium thiosulfate, and phenol red as a pH indicator29.
The medium was prepared, sterilized, and poured into test tubes at an angle to create distinct aerobic (slant) and anaerobic (butt) regions. Bacterial inoculation was performed by stabbing the butt with a sterile inoculating needle and streaking the slant for aerobic growth29. The tubes were incubated at 37°C for 24 hrs, after which color changes, gas production, and H2S formation were recorded29:
| • | Red slant, yellow butt→Glucose fermentation only | |
| • | Yellow slant, yellow butt→Fermentation of glucose, lactose, and/or sucrose | |
| • | Red slant, red butt→No sugar fermentation (alkaline reaction) | |
| • | Gas production: Presence of bubbles or cracks in the agar | |
| • | H2S production: Formation of a black precipitate due to ferrous sulfide | |
| • | Growth patterns: Growth on the slant indicated aerobic metabolism, while growth in the butt confirmed anaerobic metabolism |
Determination of MR-VP test: The MR-VP broth was prepared by dissolving 7 g of MR-VP medium powder in 1 L of distilled water. The pH was adjusted to 6.9 before autoclaving at 121°C for 15 min (McFaddin, 2000). Sterile test tubes were filled with 5 mL of broth, sealed with sterile cotton plugs, and inoculated with bacterial cultures using a sterile wire loop. The tubes were incubated at 37°C for 28 hrs22,29.
Methyl red (MR) test: After incubation, 2.5 mL of culture was transferred to a sterile test tube, and five drops of methyl red indicator were added. The tube was gently shaken and left to settle for 30 min. A red color indicated a positive MR test, signifying stable acid production from mixed acid fermentation, whereas a yellow color indicated a negative result28,29.
Voges-proskauer (VP) test: In the remaining 2.5 mL of culture, five drops of Reagent A (alpha-naphthol) and 1 mL of Reagent B (40% KOH) were added. The tube was shaken vigorously for 30 sec and left to stand at room temperature for 15-20 min. A red or pink color indicated a positive VP test, confirming acetoin production, whereas a copper or no color change indicated a negative result22. Results were recorded accordingly.
Statistical analysis: The data obtained was summarized in weekly biogas production and ambient temperature using means and standard deviations. One-way Analysis of Variance (ANOVA) was employed to assess whether significant differences exist in biogas production and temperature across the 7 weeks. Post-hoc tests, such as Tukey’s Honest Significant Difference (HSD), are used to identify specific weeks with significant differences.
RESULTS
Biogas yield and temperature variations of anaerobic digestion of cow dung over 7 weeks retention periods: The results of biogas yield at retention periods of 7, 14, 21, 28, 35, and 42 days showed that, the highest yield was recorded at 28 days with (3223.33±1377.47 mL), and a temperature of (36.5±1.5), followed by 21 days with (2360.00±183.58 mL) and a temperature of (34.0±1.0) and 14 days with (863.33±100.17 mL) and a temperature of (31.0±1.0). The least biogas yield was observed at 42 days with (70.00±20.00 mL), and a temperature of (26.2±1.5) and are not significantly different (p<0.05) (Table 1).
pH of cow dungs before and after anaerobic digestion over a week retention period: The findings of pH before digestion showed that the highest pH value was observed at 35 days with (7.85±0.211), followed by 14 days with (7.93±0.223), followed by 21 days with (7.82±0.345), and the least value was at 49 days with (7.07±0.200). Similarly, the findings of pH after digestion showed that the highest pH value was at 49 days with (6.87±0.432), followed by 7 days with (6.52±0.200), followed by 42 days with (6.52±0.232), and the least was at 28 days with (5.59±0.003) as shown in (Table 2).
Isolation and characterization of bacterial isolates from cow dung’s digesters: The bacteria isolated from cow dung’s digesters were Bacillus subtilis, Salmonella species, Escherichia coli, Clostridium spp., Corynebacterium spp., Salmonella sp., Pseudomonas aeruginosa, and Bacillus cereus as shown in (Table 3).
Percentage frequency of occurrence of bacteria isolated from cow dungs digesters: The result showed that Bacillus subtilis had the highest percentage of occurrence with (29.17%), followed by Bacillus cereus with (20.83%), followed by Escherichia coli with (16.67%) each and least was Clostridium spp., with (4.16%) as shown in (Table 4).
The microscopic examination of bacterial isolates from digested cow dung reveals diverse morphological features, as shown in Fig. 2. Bacillus subtilis Fig. 2a appears as elongated, Gram-positive rods arranged in chains, with distinct sub-terminal spores giving a slightly swollen appearance at one end. Salmonella species Fig. 2b are Gram-negative, rod-shaped bacteria that appear as small, evenly dispersed cells, often forming loose clusters. Escherichia coli Fig. 2c is observed as short, Gram-negative rods with rounded edges, scattered throughout the field of view, sometimes appearing in pairs. Clostridium spp., Fig. 2d exhibit Gram-positive, thick rod-shaped cells, often appearing singly, with visible terminal or sub-terminal spores giving a drumstick-like shape. Corynebacterium spp., Fig. 2e display Gram-positive, slightly curved rods arranged in characteristic V- or Y-shaped palisades. Pseudomonas aeruginosa Fig. 2f appears as slender, Gram-negative rods with a uniform size, distributed individually without any notable clustering. Lastly, Bacillus cereus Fig. 2g is seen as Gram-positive, rod-shaped cells arranged in long chains, with prominent central spores that give the cells a slightly bulging appearance.
| Table 1: | Biogas yield and temperature variations of anaerobic digestion of cow dung over 7 weeks retention periods | |||
| Retention period (days) | Biogas yield | Temperature (°C) |
| 7 | 130.00±34.64bc | 26.5±1.0ab |
| 14 | 863.30±100.20a | 31.0±1.0b |
| 21 | 2360.00±183.60a | 34.0±1.0ab |
| 28 | 3223.00±1377.00a | 36.5±1.5b |
| 35 | 1320.00±525.7b | 34.0±1.0b |
| 42 | 410.0±138.9b | 29.0±1.0ab |
| 49 | 70.00±20.00b | 26.2±1.5b |
| Results are expressed as Mean±Standard Deviation and Means with the same letters are not significantly different (p<0.05) | ||
| Table 2: | pH of cow dungs before and after anaerobic digestion over 7 weeks retention period | |||
| Retention period (days) | Cow dung (before) | Cow dung (after) |
| 7 | 7.01±0.312a | 6.52±0.200b |
| 14 | 7.93±0.223a | 6.45±0.012b |
| 21 | 7.82±0.345a | 5.68±0.001b |
| 28 | 7.72±0.222a | 5.59±0.003b |
| 35 | 7.85±0.211a | 6.11±0.132b |
| 42 | 7.39±0.332a | 6.52±0.232b |
| 49 | 7.07±0.200a | 6.87±0.432b |
| Results are expressed as Mean±Standard Deviation and Means with the same letters are not significantly different (p<0.05) | ||

|
| Table 3: | Isolation and characterization of bacterial isolates from cow dung digesters | |||
| Isolates | Gram reaction | Cat. | Oxi. | Cit. | Ure. | Ind. | Glu. | Suc. | Lac. | H2S | Gas | MR | VP | Bacterial Identified |
| C1 (a) | Gram-positive rod-shaped chains, with visible spores |
+ | - | + | - | - | + | + | - | - | - | - | + | Bacillus cereus |
| C1 (b) | Gram-positive rod-shaped with chains and sub-terminal |
+ | + | + | - | - | + | + | + | - | + | - | + | Bacillus subtilis |
| C1 (c) | Gram-negative rod-shaped with short chains |
+ | - | + | - | - | + | - | - | + | + | + | - | Salmonella species |
| C2 (a) | Gram-positive rod-shaped chains with and sub-terminal |
+ | + | + | - | - | + | + | + | - | + | - | + | Bacillus subtilis |
| C2 (b) | Gram-negative rod-shaped with single and pair chain |
+ | - | - | - | + | + | + | + | - | + | + | - | Escherichia coli |
| C2 (c) | Gram-positive rod-shaped with single |
- | - | + | - | + | + | - | - | + | + | + | - | Clostridium spp. |
| C3 (a) | Gram-positive rod-shaped with single cells |
+ | - | - | - | + | + | - | - | - | + | + | - | Corynebacterium spp. |
| C3 (b) | Gram-negative rod-shaped with single cells |
+ | + | + | - | - | + | - | - | - | - | - | - | Pseudomonas aeruginosa |
| C3 (c) | Gram-positive rod-shaped with chains |
+ | - | + | - | - | + | + | - | - | - | - | + | Bacillus cereus |
| C (1,2,3): Cow dung’s digesters, C (abc): Replicates of cow dung’s digester, Cat.: Catalase, Oxi: Oxidase, Cit.: Citrate, Ure.: Urease, Ind.: Indole, Glu.: Glucose, Suc.: Sucrose, Lac.: Lactose, H2S: Hydrogen sulphide, MR.: Methyl red and VP.: Voges Proskauer | ||||||||||||||
| Table 4: | Percentage frequency of occurrence of bacteria isolated from cow dung’s digesters | |||
| Bacteria identified | Number of species | Occurrence (%) |
| Bacillus subtilis | 7 | 29.17 |
| Salmonella species | 3 | 12.50 |
| Escherichia coli | 4 | 16.67 |
| Clostridium spp. | 1 | 4.16 |
| Corynebacterium spp. | 2 | 8.33 |
| Pseudomonas aeruginosa | 2 | 8.33 |
| Bacillus cereus | 5 | 20.83 |
| Total | 24 | 100.00 |
The bacteria isolated from digested cow dung exhibit distinct colonial morphologies, which are crucial for their identification in the laboratory. Bacillus subtilis typically forms large, dry, and rough colonies that are off-white to cream in color, with a wrinkled surface and a somewhat filamentous appearance. Salmonella species, on the other hand, produce smooth, moist, and round colonies that are usually pale yellow or off-white and glossy in texture. Escherichia coli forms small, smooth, and moist colonies that are cream or pale yellow, with some strains producing mucoid colonies. Clostridium spp., display large, irregular colonies with a dry, granular texture and off-white or beige coloration, sometimes accompanied by hemolysis on blood agar. Corynebacterium spp., colonies are small, round, and smooth, with a grayish or pale-yellow color and slightly raised surfaces, sometimes showing irregular shapes. Pseudomonas aeruginosa is noted for its smooth, shiny colonies that are typically grayish-white but can produce a characteristic blue-green pigment, pyocyanin, giving them a distinct blue or green hue. Lastly, Bacillus cereus forms large, round colonies with rough, irregular edges, and cream to white coloration, sometimes exhibiting hemolysis Fig. 2(a-g).
DISCUSSION
Biogas, a renewable energy source primarily composed of methane and carbon dioxide, offers a sustainable alternative to fossil fuels while addressing organic waste management challenges33,34. This study investigated the biogas yield from the anaerobic digestion of cow dung over a 7 weeks retention period, focusing on the influence of temperature variations and microbial activity.
Biogas production exhibited a characteristic trend, with an initial low yield of 130.00±34.64 mL at day 7 due to the establishment phase of methanogenic microbes, consistent with Darwin et al.35. As microbial communities matured, biogas yield increased significantly to 863.30±100.20 mL by day 14, coinciding with a temperature rise to 31.0±1.0°C, aligning with Adelekan et al.36. Peak biogas production occurred at day 28 (3223.00±1377.00 mL) at an optimal temperature of 36.5±1.5°C, supporting previous findings that maximum yield is achieved between 25 and 32 days34. Beyond this period, substrate depletion and ammonia accumulation led to a progressive decline in gas yield, dropping to 1320.00±525.7 mL by day 35 and 70.0±20.0 mL by day 49, consistent with Li et al.37.
This study confirms that temperature plays a crucial role in biogas production efficiency, with mesophilic conditions (30-40°C) optimizing methane generation. The findings emphasize the need for improved temperature control and co-digestion strategies to sustain biogas yield beyond 30 days33.
The pH range observed in this study falls within the acceptable limits for anaerobic digestion (AD), aligning with Zainudeen et al.38.
The significant drop in pH from 7.82 to 5.68 during the 3rd week is consistent with findings by Zainudeen et al.38, who attributed it to the accumulation of volatile fatty acids (VFAs), lowering pH to 5.5-5.8. Similarly, Christ39 observed a more gradual decline to 6.0, likely influenced by microbial composition and substrate buffering capacity.
As pH continued to drop to 5.59 in the fourth week, it corresponded with peak VFAs production, as reported by Ogunkunle et al.40, who recorded values between 5.5 and 5.7. Adekunle and Okolie (2015) also noted that pH levels below 5.8 indicate a transition to methanogenesis if proper buffering occurs. However, Tasnim et al.41 reported slightly higher values (6.0-6.3), suggesting variability based on substrate composition and system conditions.
A recovery in pH to 6.11 by the 5th week aligns with Zainudeen et al.38, who observed that methanogenic bacteria become more active, stabilizing pH between 5.9 and 6.2. Similarly, Sultana et al.42 reported a range of 6.0-6.5 as VFAs are converted to methane. In contrast, Ogunkunle et al.40 recorded slower recovery rates, with pH values remaining below 6.0, indicating potential process inhibition.
By the 6th week, pH increased to 6.52, consistent with Tasnim et al.41, who found that mature digestion systems exhibit pH levels of 6.5-6.8 due to methanogenic dominance and VFAs utilization. Christy et al.39 also confirmed that methanogens stabilize pH at this stage. However, Zainudeen et al.38 reported slightly lower values (6.0-6.3), possibly due to variations in inoculum efficiency and feedstock characteristics.
The final pH increase to 6.87 in the 7th week aligns with Sultana et al.42, who reported stabilization between 6.7 and 7.0 due to full methanogenic activity. This is further supported by Budiyono et al.43, who recorded values between 6.8 and 7.2, indicating complete digestion. However, Tasnim et al.41 found slightly lower final values (6.5-6.7), possibly due to residual VFAs or incomplete digestion.
The post-biogas production increase in pH is attributed to protein degradation, leading to ammonia release43. Additionally, high pH concentrations result from substrate decomposition, creating favorable conditions for bacterial activity in anaerobic digestion43.
The percentage occurrence of bacterial species isolated from anaerobically digested cow dung in this study was compared with previous research findings. Bacillus subtilis was the most predominant species, comprising 29.17% of the total isolates. This aligns closely with Nayak and Kale44, who reported 30.01%, and Pasalari et al.45, who also identified Bacillus spp., as a major component in anaerobic digestion, highlighting its crucial role in organic matter degradation.
Salmonella species were detected at 13.00%, consistent with work of Bhatt et al.46, while Charles47 found a lower occurrence (9.00%), possibly due to variations in digestion conditions and bacterial inactivation efficiency47. Escherichia coli, which plays a role in the acidogenic stage of anaerobic digestion, was present at 16.67%, closely matching Oladeji et al.48 (17.02%) and slightly higher than Menezes et al.49 (13.00%), suggesting that digester temperature and retention time influence its prevalence.
Clostridium spp., involved in the acetogenic stage of anaerobic digestion50, was detected at 4.16%, which is lower than the value reported by Lorine et al.51 with (6.2%), potentially due to prolonged anaerobic conditions favoring Clostridium growth. Corynebacterium spp., accounted for 8.33%, aligning with Bhatt et al.46 with (7.5-8.5%) which may be due to methodological differences in bacterial isolation.
Pseudomonas aeruginosa was detected at 8.33%, similar to Nayak and Kale44 with (8-10%), but lower than Menezes et al.49 with (11%), indicating environmental factors influencing microbial composition. Bacillus cereus was identified with a 20.83% occurrence, in close agreement with the value recorded by Menezes et al.49 (19%), reinforcing its prevalence in digested manure.
CONCLUSION
Biogas production from cow dung is influenced by retention time, temperature, and microbial activity, with peak yield observed in the 4th week. The process follows three phases: Lag (minimal gas production), exponential (rapid methane generation), and decline (substrate depletion). The pH decreases during digestion, reaching its lowest at peak production due to volatile fatty acids, then recovers post-digestion as methanogenic bacteria stabilize the process. Bacillus subtilis was the dominant microbial species, while Clostridium spp. had the lowest occurrence. Enhancing biogas yield requires microbial inoculants, pre-treatments, and co-digestion strategies. Future research should explore metagenomics and advanced co-digestion techniques.
SIGNIFICANCE STATEMENT
This study investigates how temperature and pH variations affect the microbial communities in cow dung, with an emphasis on the biochemical characteristics of bacteria involved in biogas production. The findings contribute to the optimization of biogas production processes by providing a deeper understanding of microbial activity in anaerobic conditions. This research has implications for sustainable energy development, particularly in rural and agricultural communities, by improving biogas yields and enhancing waste-to-energy technologies.
REFERENCES
- Ngumah, C.C., J.N. Ogbulie, J.C. Orji, and E.S. Amadi, 2013. Biogas potential of organic waste in Nigeria. J. Urban Environ. Eng., 7: 110-116.
- Adeleke, A.J., O.M. Ajunwa, J.A. Golden, U.E. Antia and A.T. Adesulu-Dahunsi et al., 2023. Anaerobic digestion technology for biogas production: Current situation in Nigeria (A review). UMYU J. Microbiol. Res., 8: 153-164.
- Sher, F., N. Smječanin, H. Hrnjić, A. Karadža, R. Omanović, E. Šehović and J. Sulejmanović, 2024. Emerging technologies for biogas production: A critical review on recent progress, challenges and future perspectives. Process Saf. Environ. Prot., 188: 834-859.
- Orhorhoro, E.K. and O. Oghoghorie, 2019. Review on solid waste generation and management in Sub-Saharan Africa: A case study of Nigeria. J. Appl. Sci. Environ. Manage., 23: 1729-1737.
- Rasapoor, M., B. Young, R. Brar, A. Sarmah, W.Q. Zhuang and S. Baroutian, 2020. Recognizing the challenges of anaerobic digestion: Critical steps toward improving biogas generation. Fuel, 261.
- Hagos, K., J. Zong, D. Li, C. Liu and X. Lu, 2017. Anaerobic co-digestion process for biogas production: Progress, challenges and perspectives. Renewable Sustainable Energy Rev., 76: 1485-1496.
- Subbarao, P.M.V., T.C. D’Silva, K. Adlak, S. Kumar, R. Chandra and V.K. Vijay, 2023. Anaerobic digestion as a sustainable technology for efficiently utilizing biomass in the context of carbon neutrality and circular economy. Environ. Res., 234.
- Wainaina, S., M.K. Awasthi, S. Sarsaiya, H. Chen and E. Singh et al., 2020. Resource recovery and circular economy from organic solid waste using aerobic and anaerobic digestion technologies. Bioresour. Technol.
- Paramaguru, G., M. Kannan, P. Lawrence and D. Thamilselvan, 2017. Effect of total solids on biogas production through anaerobic digestion of food waste. Desalin. Water Treat., 63: 63-68.
- Ibrahim, M., L. Barau, M. Alhassan, Z.S. Gidadawa and H. dan Galadima, 2019. Assessment of environmental impact of solid waste generation and disposal in Sokoto Metropolis. Int. J. Sci. Res. Publ., 9: 376-383.
- Anukam, A., A. Mohammadi, M. Naqvi and K. Granström, 2019. A Review of the chemistry of anaerobic digestion: Methods of accelerating and optimizing process efficiency. Processes, 7.
- Khanal, S.K., F. Lü, J.W.C. Wong, D. Wu and H. Oechsner, 2021. Anaerobic digestion beyond biogas. Bioresour. Technol., 337.
- Iglesias, R., R. Muñoz, M. Polanco, I. Díaz and A. Susmozas et al., 2021. Biogas from anaerobic digestion as an energy vector: Current upgrading development. Energies, 14.
- Atedhor, G.O., 2015. Agricultural vulnerability to climate change in Sokoto State, Nigeria. Afr. J. Food Agric. Nutr. Dev., 15: 9855-9871.
- Tsoho, B.A. and S.A. Salau, 2012. Profitability and constraints to dry season vegetable production under Fadama in Sudan Savannah ecological zone of Sokoto State, Nigeria. J. Dev. Agric. Econ., 4: 214-224.
- Ifabiyi, I.P. and S. Ojoye, 2013. Rainfall trends in the Sudano-Sahelian ecological zone of Nigeria. Earth Sci. Res., 2: 194-202.
- Ojoko, E., J.A. Akinwunmi, S.A. Yusuf and O.A. Oni, 2017. Factors influencing the level of use of climate-smart agricultural practices (CSAPs) in Sokoto State, Nigeria. J. Agric. Sci., 62: 315-327.
- Obaroh, I.O., U. Abubakar, M.A. Haruna and M.C. Elinge, 2015. Evaluation of some heavy metals concentration in River Argungu. J. Fish. Aquat. Sci., 10: 581-586.
- Ladan, S.I., 2014. An appraisal of climate change and agriculture in Nigeria. J. Geogr. Reg. Plann., 7: 176-184.
- Onwuliri, F.C., I.A. Onyimba and I.A. Nwaukwu, 2013. Generation of biogas from cow dung. J. Bioremed. Biodegrad.
- Rabah, A.B., A.S. Baki, L.G. Hassan, M. Musa and A.D. Ibrahim, 2010. Production of biogas using abattoir waste at different retention time. Sci. World J., 5: 23-26.
- Agrawal, A., P.K. Chaudhari and P. Ghosh, 2024. Effect of inoculums type and optimization of inoculum to substrate ratio on the kinetics of biogas production of fruit and vegetable waste. Environ. Eng. Res., 29.
- Barua, V.B., V. Rathore and A.S. Kalamdhad, 2019. Anaerobic co-digestion of water hyacinth and banana peels with and without thermal pretreatment. Renewable Energy, 134: 103-112.
- Masinde, B.H., D.M. Nyaanga, M.R. Njue and J.W. Matofari, 2020. Optimization of biogas production in a batch laboratory digester using total solids, substrate retention time, and mesophilic temperature. Int. J. Power Energy Res., 4: 17-26.
- Babaei, A. and J. Shayegan, 2019. Effects of temperature and mixing modes on the performance of municipal solid waste anaerobic slurry digester. J. Environ. Health Sci. Eng., 17: 1077-1084.
- Adekunle, K.F. and J.A. Okolie, 2015. A review of biochemical process of anaerobic digestion. Adv. Biosci. Biotechnol., 6: 205-212.
- Chiu, Y.C., H.C. Lai, T.Y. Lee and Y.C. Liaw, 2008. Technological diversification, complementary assets, and performance. Technol. Forecasting Social Change, 75: 875-892.
- Valgas, C., S.M. de Souza, E.F.A. Smânia and A. Smânia Jr, 2007. Screening methods to determine antibacterial activity of natural products. Braz. J. Microbiol., 38: 369-380.
- Madigan, M.T, K.S. Bender, D.H. Buckley, W.M. Sattley and D.A. Stahl, 2019. Brock Biology of Microorganisms. 15th Edn., Pearson, Hudson Street, NY, USA, ISBN: 9781292235103.
- Amha, Y.M., P. Sinha, J. Lagman, M. Gregori and A.L. Smith, 2017. Elucidating microbial community adaptation to anaerobic co-digestion of fats, oils, and grease and food waste. Water Res., 123: 277-289.
- Vavilin, V.A., B. Fernandez, J. Palatsi and X. Flotats, 2008. Hydrolysis kinetics in anaerobic degradation of particulate organic material: An overview. Waste Manage., 28: 939-951.
- Zhang, L., A. Kuroki and Y.W. Tong, 2020. A mini-review on in situ biogas upgrading technologies via enhanced hydrogenotrophic methanogenesis to improve the quality of biogas from anaerobic digesters. Front. Energy Res., 8.
- Surendra, K.C., D. Takara, A.G. Hashimoto and S.K. Khanal, 2014. Biogas as a sustainable energy source for developing countries: Opportunities and challenges. Renewable Sustainable Energy Rev., 31: 846-859.
- Benali, M., T. Hamad and Y. Hamad, 2019. Experimental study of biogas production from cow dung as an alternative for fossil fuels. J. Sustainable Bioenergy Syst., 9: 91-97.
- Darwin, Mardhotillah and A. Pratama, 2021. Anaerobic co-digestion of oil palm frond waste with cow manure for biogas production: Influence of a stepwise organic loading on the methane productivity. Bull. Transilvania Univ. Braşov. Series II: For. Wood Ind. Agric. Food Eng., 14: 99-112.
- Adelekan, B.A. and A.I. Bamgboye, 2009. Comparison of biogas productivity of cassava peels mixed in selected ratios with major livestock waste types. Afr. J. Agric. Res., 4: 571-577.
- Li, Y., S.Y. Park and J. Zhu, 2011. Solid-state anaerobic digestion for methane production from organic waste. Renewable Sustainable Energy Rev., 15: 821-826.
- Zainudeen, M.N., M. Kwarteng, A. Nyamful, L. Mohammed and M. Mutala, 2021. Effect of temperature and pH variation on anaerobic digestion for biogas production. Ghana J. Agric. Sci., 56: 1-13.
- Christy, P.M., L.R. Gopinath and D. Divya, 2014. A review on anaerobic decomposition and enhancement of biogas production through enzymes and microorganisms. Renewable Sustainable Energy Rev., 34: 167-173.
- Ogunkunle, O., K.O. Olatunji and J.O. Amos, 2018. Comparative analysis of co-digestion of cow dung and Jatropha cake at ambient temperature. J. Fundam. Renewable Energy Appl., 8.
- Tasnim, F., S.A. Iqbal and A.R. Chowdhury, 2017. Biogas production from anaerobic co-digestion of cow manure with kitchen waste and water hyacinth. Renewable Energy, 109: 434-439.
- Sultana, M., M. Jahiruddin, M. Rafiqul Islam, M. Mazibur Rahman and M. Anwarul Abedin, 2020. Effects of nutrient enriched municipal solid waste compost on yield and nutrient content of cabbage in alluvial soil. Asian J. Soil Sci. Plant Nutr., 6: 32-42.
- Budiyono, I.N. Widiasa, S. Johari and Sunarso, 2010. The influence of total solid contents on biogas yield from cattle manure using rumen fluid inoculum. Energy Res. J., 1: 6-11.
- Nayak, S. and S. Kale, 2020. Chemical and microbiological analysis of organic manure of Nisargruna biogas plant and its applications as carrier materials for biofertilizers. Curr. World Environ., 15: 535-543.
- Pasalari, H., M. Gholami, A. Rezaee, A. Esrafili and M. Farzadkia, 2021. Perspectives on microbial community in anaerobic digestion with emphasis on environmental parameters: A systematic review. Chemosphere, 270.
- Bhatt, P., P. Poudyal, P. Dhungana, B. Prajapati and S. Bajracharya et al., 2024. Enhancement of biogas (methane) production from cow dung using a microbial electrochemical cell and molecular characterization of isolated methanogenic bacteria. Biomass, 4: 455-471.
- Charles, O.E.V., 2021. Study of the microbial composition and comparative biogas production from fresh, dried and cow-dung seeded pumpkin (Cucurbita maxima) residue. Earthline J. Chem. Sci., 5: 221-230.
- Oladeji, A.A., A.O. Adeniyi, H. Adamu, A.F. Kemi and A. Sabo, 2024. Isolation and identification of some bacteria associated with biogas production from food waste and rumen content. Indones. J. Innovation Appl. Sci., 4: 1-11.
- Menezes, K.V., C.E. de Souza Duarte, M.G. Moreira, T. de Jesus Cattem Moreno and V.J. da Silva Pereira et al., 2024. Enterobacteria in anaerobic digestion of dairy cattle wastewater: Assessing virulence and resistance for one health security. Water Res., 252.
- Chen, Y., J.J. Cheng and K.S. Creamer, 2008. Inhibition of anaerobic digestion process: A review. Bioresour. Technol., 99: 4044-4064.
- Lorine, D., D. Céline, L.M. Caroline, B. Frédéric and H. Lorette et al., 2021. Influence of operating conditions on the persistence of E. coli, enterococci, Clostridium perfringens and Clostridioides difficile in semi-continuous mesophilic anaerobic reactors. Waste Manage., 134: 32-41.
How to Cite this paper?
APA-7 Style
Shehu,
A., Maishanu,
H.M., Yelwa,
S.M., Baki,
A.S. (2025). Anaerobic Digestion of Cow Dung for Biogas Production in Kara Market, Sokoto, Nigeria. Asian Journal of Biological Sciences, 18(3), 679-692. https://doi.org/10.3923/ajbs.2025.679.692
ACS Style
Shehu,
A.; Maishanu,
H.M.; Yelwa,
S.M.; Baki,
A.S. Anaerobic Digestion of Cow Dung for Biogas Production in Kara Market, Sokoto, Nigeria. Asian J. Biol. Sci 2025, 18, 679-692. https://doi.org/10.3923/ajbs.2025.679.692
AMA Style
Shehu
A, Maishanu
HM, Yelwa
SM, Baki
AS. Anaerobic Digestion of Cow Dung for Biogas Production in Kara Market, Sokoto, Nigeria. Asian Journal of Biological Sciences. 2025; 18(3): 679-692. https://doi.org/10.3923/ajbs.2025.679.692
Chicago/Turabian Style
Shehu, Abdulkadir, Hassan Muhammad Maishanu, Sabi’u Muhammad Yelwa, and Aliyu Sarkin Baki.
2025. "Anaerobic Digestion of Cow Dung for Biogas Production in Kara Market, Sokoto, Nigeria" Asian Journal of Biological Sciences 18, no. 3: 679-692. https://doi.org/10.3923/ajbs.2025.679.692

This work is licensed under a Creative Commons Attribution 4.0 International License.