Quality Trait Evaluation of Thigh Meat in Chicken Genotypes Under On-Station Condition
-
Atsbaha Hailemariam Gebreslassie


Ethiopia Agricultural Research Institute Debrezeit Agricultural Research Center, Bishoftu, Ethiopia
| Received 07 Mar, 2025 |
Accepted 25 May, 2025 |
Published 30 Sep, 2025 |
Background and Objective: The evaluation of thigh meat quality in different chicken genotypes under on-station conditions is crucial for improving poultry production, meat quality, and consumer preferences. This study evaluated the thigh meat quality traits of six chicken genotypes under on-station conditions: Cosmopolitan (C), Improved horro (H), ♂Improved horro×cosmopolitan♀ (HC), ♂Cosmopolitan×improved horro♀ (CH), indigenous (L), and koekoek (KK). The objective was to assess genetic influences on meat quality over 24 weeks. Materials and Methods: A Completely Randomized Design (CRD) was used, and data were analyzed with the general linear model (GLM) in SAS software. A total of 144 chickens (24 per genotype) were slaughtered, and each thigh sample was replicated six times for analysis. Meat quality traits, including shear force (WBSF), water-holding capacity (WHC), pH at 45 min (pH 45) and 24 hrs (pH 24), cooking loss (CL), drip loss (DL), and color parameters (L*, a*, b*, C*, h*), were considered significant at p<0.05. Results: The highest WBSF was recorded in KK, followed by C and CH, while L had the lowest. The thigh meats from L and HC exhibited the highest WHC, whereas KK had the lowest. The pH45 was highest in L and lowest in KK. The pH24 was significantly higher in L, while C, CH, and KK showed the lowest values. The CL was greater in KK, CH, and C, while DL was highest in KK and CH. Lightness (L*), chroma (C*), and hue angle (h*) were highest in KK, CH, and C, whereas L had the lowest L*. Conclusion: Genetic variations significantly affect thigh meat quality traits in chickens. Further research should investigate the biochemical mechanisms underlying these differences.
| Copyright © 2025 Atsbaha Hailemariam Gebreslassie. This is an open-access article distributed under the Creative Commons Attribution License, which permits unrestricted use, distribution, and reproduction in any medium, provided the original work is properly cited. |
INTRODUCTION
It appears that the chicken industry is the most adaptable and fast-growing of all livestock industries, increasing in both industrialized and emerging nations and contributing to the food and nutrition security improvement at global, regional, and country levels1. In Ethiopia, the potential contribution of the poultry industry to improve food security, meat consumption, and nutrition, and its contribution to economic growth is immense2. Results demonstrated that the growth and carcass trait performances might affect the quality of the meat of poultry breeds3. From the perspective of customers and industries, the quality of chicken meat is increasingly becoming a significant issue. The differences in chicken genotypes could be attributed to the variation in the meat quality of chickens4. Studies have shown that chicken meat is in higher demand because it is rich in protein, low in fat and cholesterol, and relatively lower in price5.
Similarly, consuming chicken meat is not prohibited by any culture or beliefs6. Studies have shown that factors such as breed, strain, age, sex, and diet can impact meat characteristics7. Color, pH, water-holding capacity, drip loss, cook loss, and shear force are factors that determine the quality of meat product8.
Scholars suggest that chicken meat color is a key factor influencing consumer preference at the point of sale, as it serves as a primary indicator of meat wholesomeness9. While, hemoglobin and cytochrome C can contribute to color variation, myoglobin is the dominant pigment responsible for meat color and plays a crucial role in determining its physical and chemical properties10.
According to some sources, the CIE L*a*b* and Munsell C*h* systems can be used to measure the color of meat as well as utilizing physical senses11. According to some sources, the amount of glycogen stored in the muscle after slaughter has a major impact on the pH value of the meat characteristics12,13. Research has confirmed that pH levels measured at 45 min and 24 hrs are essential indicators for assessing chicken meat quality parameters14. Findings suggest that typical meat pH values are between 6.01-6.70 at 45 min postmortem and between 5.50-6.01 at 24 hrs postmortem of the poultry breed15. A pH reading of less than 5.70 at 45 min after death is indicative of pale, soft, exudative of the chicken meat characteristics16, while meat that has a pH value of more than 6.20 at 24 hrs after death is considered dark, firm, and dry and affects the meat quality characteristics17.
According to reports, one of the main factors that buyers consider when buying meat and meat products is meat tenderness characteristics18 and the Warner-Bratzler or Kramer Shear Force Method can be used to determine the tenderness of meat of the poultry breed19. The ability of meat to maintain its water or absorb additional water when force is applied is known as its water-holding capacity of the poultry meat20. Some studies highlight that water-holding capacity is crucial for both whole cuts and processed meat products of the chicken breeds21. The results indicate that a lower pH is linked to reduced water-holding capacity (WHC), leading to higher cooking and drip loss of the meat of poultry breed22.
It has been stated that Ethiopia’s genetically improved Horro genotype (H) increases growth and egg production performance23. The cosmopolitan chicken (C) is described as an imported breed, representing the diversity of chicken varieties24. Further, South Africa is where the koekoek (KK) dual-purpose chicken was imported, maintained, and reared in Ethiopia25. The indigenous chicken (L) was used as a reference after the selection and breedng26. Since the cosmopolitan genotype was newly imported to Ethiopia, it is clear that it, too, requires initial research data and documentation before being distributed and used as a source for further research and development27. The cosmopolitan (C) and improved horro (H) chicken breeds were crossed using both direct and reciprocal mating strategies-Cosmopolitan♂×improved horro♀ (CH) and Improved horro♂×cosmopolitan♀ (HC)-to evaluate possible differences in thigh meat quality traits. The resulting traits were subsequently compared with those of the indigenous (L) and koekoek (KK) genotypes. The objective of the study was to compare the quality traits of thigh meat under on-station conditions. Specifically, the study aimed to evaluate various meat quality parameters among different chicken genotypes. These parameters included instrumental tenderness, drip loss, cooking loss, water-holding capacity, and pH of the thigh meat. By analyzing these traits, the study sought to provide insights into the variations in meat quality among different chicken genotypes.
MATERIALS AND METHODS
Description of the study areas: The experiment was carried out at the Werer Agricultural Research Centre (WARC) in Ethiopia, located 280 km from the capital, Addis Ababa. The center sits at an altitude of 820 m above sea level, with coordinates of 55 N Latitude and 40°40 E Longitude. The annual rainfall at WARC ranges from 400-600 mm, with average minimum and maximum temperatures of 19.3 and 45°C, respectively.
Ethical approval, experimental animals, management, and sampling procedures
Ethical approval and experimental animals: This study was carried out in conjunction with the research of Hailemariam et al.24 and was managed following the Institutional Animal Care and Use Committee’s (IACUC) authorized procedures. The experiment was conducted by selecting 144 chickens for slaughter using six genotypes that were equally replicated. The experimental birds were categorized as follows:
| I | = | Improved horro (H) | |
| II | = | Cosmopolitan (C) | |
| III | = | Koekoek (KK) | |
| IV | = | Indigenous (L) | |
| V | = | Cosmopolitan♂×improved horro♀ (CH) | |
| VI | = | Improved horro♂×cosmopolitan♀ (HC) |
Management and sampling procedures: Before the experiment began, the watering and feeding troughs, as well as the laying nests, were cleaned, disinfected, and treated to prevent external parasites. Disinfected grass hay was used to cover the floor of each pen, and it was changed as needed. Every hen utilized in this experiment, both imported and native, was hatched on the same day. The chickens were provided with the same commercial starter, grower, and layer rations according to their age phases (Alema Koudjis; Feed Co. Ltd., Debrezeit, Ethiopia). The hens were vaccinated against Newcastle disease, Gumboro (Infectious Bursal Disease-IBD), and Fowl Typhoid using the recommended vaccines from the manufacturer (NVI-Ethiopia). Similar management was used for the experimental chickens when they were on-station. Health status was also observed. During the entire trial period, feed produced by Alema Koudjis; Feed Co. Ltd., Debrezeit, Ethiopia, was used, and supplements such as vitamin-mineral premixes and amino acids were provided according to the poultry feed manufacturer’s recommendations. The pens were also equipped with laying nests to meet all requirements.
Quality of thigh meats of different chickens
Meat color and pH: The meat color parameters (CIE L*, a*, and b* values, where L* represents lightness, a* indicates the red-green spectrum, and b* reflects the blue-yellow spectrum) were measured using a HunterLabMiniScan EZ (MSEZ-4500L, Serial No. MsEZ1547, with a 45/0° illumination/viewing system, D65 light source, and 10° observer angle). A digital colorimeter (HunterLabMiniScan EZ, Washington, DC, USA) calibrated with black and white standardized plates was used for each trial28, and each sample, three measurements were obtained at various points and averaged. Meat pH was measured using a portable pH meter (Meat PH meter-HI99163, HANAN instruments) fitted with a sharp blade electrode of the InLaB Solids Pro Puncture type. The process was carried out in compliance with the manufacturer’s guidelines. Between sample readings, the probe was calibrated using standard buffer solutions with pH values of 4.01, 7.01, and 10.01 and cleaned with distilled water. At 45 min and 24 hrs post-mortem, the pH of the thigh meat was determined. Each sample had three measurements made at three different sites, which were then averaged. Freshly exposed on a flat white background in the measuring chamber, the inside surface of the cranial part of the filleted thigh meat samples was allowed to bloom for around 45 min at room temperature (24±1.2°C) to measure the color of the thigh meat. In all, 144 genotypes-24 per genotype and 6 samples per thigh meat cut-were taken into account in this investigation. Meat pH and color values for each genotype in the current investigation were calculated by averaging the six-sample thigh meat cut. Hue and Chroma were calculated using the following formulas based on the color coordinate values and indicated here:
Hue (h) = Arctangent (b/a), Chroma (C) = (a2+b2)½ |
Water-holding capacity (WHC%): Twenty-four hrs after postmortem, the meat’s ability to retain water was determined29. Two Whatman number-1 filter papers were weighed, and a 0.5 g meat sample was placed between them, which was then positioned between two glass sheets. A weight of 2.015 kg was placed on top, and the glass sheet weighed 0.8278 kg, resulting in a total compression load of 2.8428 kg for 5 min. Afterward, the weight was removed, and the meat was taken out from the filter papers and weighed. Finally, the filter paper was dried, and its weight was recorded. The weight of the meat following pressure treatment and the quantity of protein adhered to the filter paper were then ascertained. The water holding capacity (WHC %) was calculated as:
Where:
| ASWBPT | = | Actual sample weight before pressure treatment | |
| ASWAPT | = | Actual sample weight after pressure treatment |
In this study, a total of 144 genotypes were included, with 24 per genotype and 6 samples taken from each thigh meat cut. The water-holding capacity (%) of each genotype in the current investigation was calculated by averaging the six-sample thigh meat cut.
Instrumental tenderness determination: The instrumental tenderness was assessed using the Warner-Bratzler shear force (WBSF) method. To assess instrumental tenderness using WBSF, the 70°C-cooked steak was left to cool to room temperature (24-25°C) for approximately an hour. After cooling, the steak was sliced along the long axis, positioning the knife tip on the side with dense connective tissue and the handle on the ventral side to reveal the fiber orientation. Six cores, each with a diameter of 1.27 cm, were extracted in alignment with the muscle fibers, ensuring the fibers were parallel to the core so that the shear force would be applied across the grain. Each core was sheared using the WBSF device. On each core, the shear occurred across the middle (center). For every core, the WBSF peak values were noted in N (Newton). The value for each steak was calculated using the average values for the six cores. Meat samples were categorized as very tender, tender, intermediate, or tough based on Warner-Bratzler Shear Force (WBSF) values:
| Very tender | = | WBSF<31.4 N | |
| Tender | = | 31.4 N | |
| Intermediate | = | 38.3 N | |
| Tough | = | WBSF>45.1 and indicated in Hailemariam et al.1 and Mueller et al.28 |
To calculate the instrumental meat tenderness of each genotype in the current investigation, the thigh meat cuts from 144 genotypes with equal replicas of each chicken were measured six times and averaged.
Drip loss (%): The drip loss of the thigh meat samples from the reared chickens was determined using a plastic drip method, following the standard procedure of the drip loss experiment30. The meat sample was removed from 30 g of thigh and cut in the biggest section of the sampled muscle perpendicular to the fiber direction. The samples were reweighed after being kept in the refrigerator for 24 hrs at 4°C while hung in an inflated plastic bag. For the thigh meat taken into consideration in this study, the six genotypes were measured and replicated equally. In this study, a total of 144 genotypes were used, with 12 thigh cuts per genotype. The collected data were averaged to calculate the drip loss percentage for each genotype. The drip loss (DL%) was computed as:
Where:
| ISWT | = | Initial sample weight | |
| FSWT | = | Final sample weight |
Cooking loss (%): The cooking loss of thigh meat samples from the experimental chickens was assessed using a plastic drip method, following the outlined standard procedure of poultry meat trial1,30. A 30 g meat sample was cut perpendicular to the fiber direction in the widest section of the muscle. The samples were then hung inside an inflated plastic bag, stored in the refrigerator at 4°C for 24 hrs, and reweighed. This study included 144 genotypes, with 24 samples per genotype and 6 samples per thigh cut. The six samples from each thigh cut were averaged to calculate the cooking loss for each genotype. The cooking loss (CL%) was computed as:
Where:
| WRS | = | Weight of raw sample | |
| WCS | = | Weight of cooked sample |
Statistical analysis: Thigh meat quality data were recorded on a prepared sheet and entered into Excel regularly. The collected thigh meat quality data were summarized and analyzed using the GLM model in SAS software31. When the GLM indicated a significant difference at p<0.05, Duncan’s multiple range tests were applied for mean separation.
The model used was:
Yij = μ+Gi+eij |
Where:
| Yij | = | Response variables | |
| μ | = | Overall mean | |
| Gi | = | Effect of genotype (I = 1,2,3,4, 5, 6) | |
| eij | = | Random error |
RESULTS AND DISCUSSION
Effect of genotype on thigh meat quality of different chickens
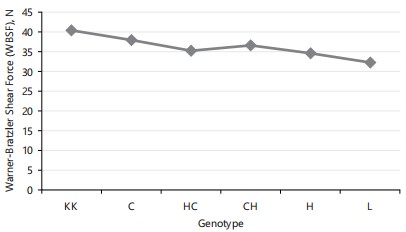
Effect of genotype on instrumental tenderness of thigh meat of different chickens: The result of the effect of genotypes on the Instrumental tenderness of thigh meat (WBSF) of different chickens is indicated in Fig. 1. The shear force (WBSF) of the KK thigh was significantly the highest (40.35 N) followed by higher values in C (37.84 N) and CH (36.43 N). The WBSF values were also high in HC (35.13 N) and H (34.54 N), while the L genotype had the lowest WBSF (32.18 N). Consistent with the findings, the variations in meat shear (WBSF) values are attributed to breed differences that influence instrument-measured tenderness of the thigh meat1,32.
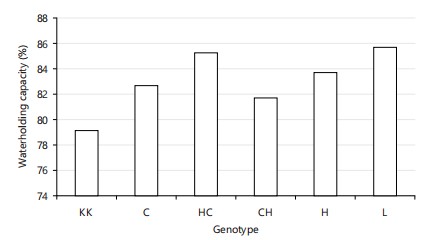
Effect of genotype on water-holding capacity of thigh meat of different chickens at 24 hrs: The result of the effect of genotype on the water-holding capacity (%) of thigh meat of different chickens at 24 hrs is indicated in Fig. 2. The thigh meats from the L (85.69) and HC (85.23) genotypes had significantly the highest water-holding capacity (WHC) values, followed by HC (83.71) and C (82.63), which also had high WHC values. The CH genotype had a lower WHC (81.74), but KK thigh meat exhibited the considerably lowest water-holding capacity (WHC) value (79.13). The differences in chicken meat WHC values have been attributed to breed variations in water retention in the meat, which can be explained by variations in composition and quality of the meat14,33.
|
|
|
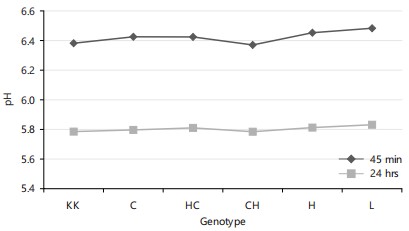
Genotype effect on pH of thigh cuts of different chickens at 45 min and 24 hrs: The result of the effect of genotype on the pH of thigh meat at 45 min and 24 hrs is presented in Fig. 3. The KK thigh had the lowest pH 45 value (6.38), with slightly higher values for C (6.42) and HC (6.42), and a lower value for CH (6.37). In contrast, the H genotype had a higher pH45 value (6.45), while the L thigh meat showed the highest pH 45 value (6.48), which was significantly greater. The L thigh exhibited a significantly higher pH 24 value (5.83) compared to the pH 24 values of the H (5.81) and HC (5.81) genotypes. In contrast, the lowest pH24 values were observed in the thigh meat from the C (5.79), CH (5.78), and KK (5.70) genotypes. The variation in meat pH is due to the degree of acidification in the meat34. The amount of glycogen accumulated in muscle at the time of slaughter is thought to be the cause of the pH differences35.
|
|
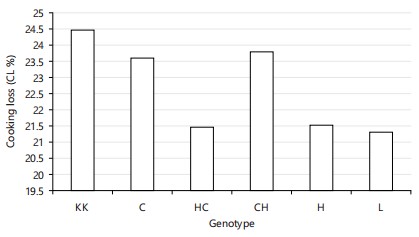
Genotype effect on cooking loss (CL) of thigh cuts of different chicken: The effect of genotype on the cooking loss (CL) percentage of thigh meat from different chicken breeds is shown in Fig. 4. The cooking loss (CL) of thigh meat was meaningfully greater in the KK (24.48), CH (23.79), and C (23.61) genotypes compared to the H (21.53), HC (21.47), and L (21.31) genotypes. Differences in glycogenolysis slaughter are the cause of the variances in CL of chicken breeds’ meat products36.
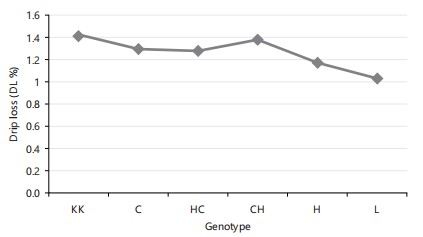
Genotype effect on driploss of different chickens: Figure 5 shows the thigh meat drip loss (DL) percentage of different chicken genotypes. Thighs from KK (1.42) and CH (1.38) showed the highest drip loss values, followed by C (1.30) and HC (1.27), which also had relatively high values. The H genotype had a lower drip loss (1.17), while the L genotype recorded the lowest and significantly reduced value (1.03). Concurrently, variations in interlocked connective tissues caused the DL meat to differ among chickens37.
Genotype effect on thigh cut color traits of different chickens: The result of the effect of genotype on thigh meat color traits of different chickens is presented in Table 1. The thigh meat from KK (55.42±0.39), CH (54.81±0.36), and C (54.54±0.37) exhibited significantly higher lightness values (L*) compared to HC (50.35±0.35) and H (50.09±0.33). In contrast, the L genotype had the lowest lightness score (49.39±0.32). Studies showed that lightness scores (L*) might be affected by genotype variation1,38.
| Table 1: | Effect of genotype on thigh meat color traits | |||
| Genotype (Mean±SE) | |||||||
| Category (color) | KK | C | HC | CH | H | L | p-value |
| L* | 55.42±0.39a | 54.54±0.37a | 50.35±0.35b | 54.81±0.36a | 50.09±0.33b | 49.39±0.32c | *** |
| a* | 4.60±0.16b | 5.39±0.21a | 4.47±0.19b | 4.53±0.18b | 4.27±0.20a | 5.28±0.23a | ** |
| b* | 14.91±1.25a | 13.72±1.24a | 10.18±1.31b | 13.93±1.67a | 9.90±0.79b | 9.05±0.82b | ** |
| C* | 15.82±0.38a | 14.74±0.36a | 11.12±0.34b | 14.91±0.28a | 10.89±0.18b | 10.51±0.16b | ** |
| h* | 70.46±1.19a | 68.56±0.73a | 66.28±0.92b | 69.23±1.16a | 65.37±0.75b | 64.14±0.68b | ** |
| Mean under the same category bear different superscript letters are significantly different, ***p<0.001, ***p<0.01 and SE: Standard error | |||||||
The redness (a*) score of thigh meat was noticeably lower in the KK (4.60±0.16), CH (4.53±0.18), and HC (4.47±0.19) genotypes compared to the H (5.27±0.20), C (5.39±0.21), and L (5.28±0.23) genotypes. A study reported that the redness (a*) score of thigh meat varied among different genotypes. The thigh meat yellowness (b*) score was significantly higher in the KK (14.91±1.25), CH (13.93±1.67), and C (13.72±1.24) genotypes compared to HC (10.18±1.31), H (9.90±0.79), and L (9.05±0.82) genotypes. The report showed that the yellowness score (b*) of chicken meat differed due to genetic effects39. The chroma (C*) score of thigh meat was notably greater in the KK (15.82±0.38), CH (14.91±0.28), and C (14.74±0.36) genotypes, compared to the HC (11.12±0.34), H (10.89±0.18), and L (10.51±0.16) genotypes. The chroma (C*) scores were significantly highest in Naked-Neck, and Hybridthanin New-Hampshire, Koekoek, and Australorp breeds and indicated meaningfull influences1,40. The thigh meat hue angle (h*) score was significantly higher in the KK (70.46±1.19), CH (69.23±1.16), and C (68.56±0.73) genotypes compared to HC (66.28±0.92), H (65.37±0.75), and L (64.14±0.68) genotypes. The hue angle (h*) scores of the meat were significantly higher in the Hybrid and Koekoek genotypes compared to the fast-growing chicken breeds1,40. The results showed that variations in meat color were influenced by differences in myoglobin content, hemoglobin structure, cytochrome C, pre- and postmortem stress, and chicken meat pH41,42. The variation in chicken meat color may be attributed to differences in the ratio of glycolytic (Type IIB) to oxidative muscle fibers (Type IIA) of the chicken breeds1,43.
CONCLUSION
The findings of this study demonstrate that genetic variations among chicken genotypes significantly influence thigh meat quality characteristics. The KK genotype displayed the highest shear force (WBSF), indicating tougher meat, while the L genotype exhibited the lowest WBSF, suggesting improved tenderness. Additionally, the L and HC genotypes had superior water-holding capacity (WHC), which is crucial for meat quality, whereas the KK genotype showed the lowest WHC, potentially affecting its juiciness. The pH values also varied among the genotypes, with the L genotype having the highest pH 45, which may be associated with better meat quality. Furthermore, significant differences were observed in cooking loss, drip loss, and color parameters, highlighting the diverse quality traits that different genotypes can offer. In conclusion, the genotype variants had a significant impact on thigh meat quality differences among the chickens. Poultry breeders should consider the findings of this study when selecting chicken genotypes for meat quality traits. Additional studies should be conducted to explore the underlying biochemical mechanisms that contribute to the observed differences in meat quality traits among various genotypes.
SIGNIFICANCE STATEMENT
This study is important as it examines the impact of genotypes on thigh meat quality traits across different chicken genotypes, including the newly introduced cosmopolitan and genetically improved Horrochickens. By comparing these with indigenous and koekoek genotypes, the research provides critical insights into optimizing poultry meat quality, production efficiency, and consumer preferences. The findings will enhance the understanding of the crossbreeding effects on thigh meat characteristics, the contribution of genetic variations, and the improvement of breeding programs. This study is particularly relevant for enhancing poultry meat quality and addressing consumer demands in Ethiopia and similar regions, offering valuable knowledge for future genetic improvement and dietary advancements.
ACKNOWLEDGMENTS
The authors express gratitude to the International Livestock Research Institute (ILRI-ACGG, Addis Ababa, Ethiopia; Grant code: BS13CRP001CRP001111) for funding the research and the Ethiopian Institute of Agricultural Research (EIAR) for providing necessary opportunities. We also thank Haramaya University as well as those who directly or indirectly contributed to the accomplishment of this study.
REFERENCES
- Hailemariam, A., W. Esatu, S. Abegaz, M. Urge, G. Assefa and T. Dessie, 2022. Effect of genotype and sex on breast meat quality characteristics of different chickens. J. Agric. Food Res., 10.
- Musundire, M.T., T.E. Halimani and M. Chimonyo, 2018. Effect of age and sex on carcass characteristics and internal organ weights of scavenging chickens and helmeted guinea fowls. J. Appl. Anim. Res., 46: 860-867.
- Fanatico, A.C., P.B. Pillai, J.L. Emmert and C.M. Owens, 2007. Meat quality of slow- and fast-growing chicken genotypes fed low-nutrient or standard diets and raised indoors or with outdoor access. Poult. Sci., 86: 2245-2255.
- Zhuang, H. and E.M. Savage, 2013. Comparison of cook loss, shear force, and sensory descriptive profiles of boneless skinless white meat cooked from a frozen or thawed state. Poult. Sci., 92: 3003-3009.
- Mazzoni, M., M. Petracci, A. Meluzzi, C. Cavani, P. Clavenzani and F. Sirri, 2015. Relationship between pectoralis major muscle histology and quality traits of chicken meat. Poult. Sci., 94: 123-130.
- Smith, D.P., J.K. Northcutt and E.L. Steinberg, 2012. Meat quality and sensory attributes of a conventional and a Label Rouge-type broiler strain obtained at retail. Poult. Sci., 91: 1489-1495.
- Petracci, M., F. Sirri, M. Mazzoni and A. Meluzzi, 2013. Comparison of breast muscle traits and meat quality characteristics in 2 commercial chicken hybrids. Poult. Sci., 92: 2438-2447.
- Wilkins, L.J., S.N. Brown, A.J. Phillips and P.D. Warriss, 2000. Variation in the colour of broiler breast fillets in the UK. Br. Poult. Sci., 41: 308-312.
- Castellini, C., C. Berri, E. le Bihan-Duval and G. Martino, 2008. Qualitative attributes and consumer perception of organic and free-range poultry meat. World's Poult. Sci. J., 64: 500-512.
- Lee, S.K., J.W. Chon, Y.K. Yun, J.C. Lee and C. Jo et al., 2022. Properties of broiler breast meat with pale color and a new approach for evaluating meat freshness in poultry processing plants. Poult. Sci., 101.
- Liu, Y., B.G. Lyon, W.R. Wyndham, C.E. Lyon and E.M. Savage, 2004. Principal component analysis of physical, color and sensory characteristics of chicken breasts deboned at two, four, six and twenty-four hours postmortem. Poult. Sci., 83: 101-108.
- Cömert, M., Y. Şayan, F. Kırkpınar, Ö.H. Bayraktar and S. Mert, 2016. Comparison of carcass characteristics, meat quality, and blood parameters of slow and fast grown female broiler chickens raised in organic or conventional production system. Asian-Australas. J. Anim. Sci., 29: 987-997.
- Cavitt, L.C., G.W. Youm, J.F. Meullenet, C.M. Owens and R. Xiong, 2004. Prediction of poultry meat tenderness using razor blade shear, Allo-Kramer shear and sarcomere length. J. Food Sci., 69: SNQ11-SNQ15.
- Sarsenbek, A., T. Wang, J.K. Zhao and W. Jiang, 2013. Comparison of carcass yields and meat quality between Baicheng-You chickens and Arbor Acres broilers. Poul. Sci., 92: 2776-2782.
- Haunshi, S., S. Devatkal, L.L.L. Prince, R. Ullengala, K. Ramasamy and R. Chatterjee, 2022. Carcass characteristics, meat quality and nutritional composition of Kadaknath, a native chicken breed of India. Foods, 11.
- Biesek, J., M. Banaszak, S. Wlaźlak and M. Adamski, 2022. The effect of partial replacement of milled finisher feed with wheat grains on the production efficiency and meat quality in broiler chickens. Poult. Sci., 101.
- Chodová, D., E. Tůmová, M. Ketta and V. Skřivanová, 2021. Breast meat quality in males and females of fast-, medium- and slow-growing chickens fed diets of 2 protein levels. Poult. Sci., 100.
- Cruz, F.L., A.A. Silva, I.F.M. Machado, L.C. Vieira, C. Esteves, E.J. Fassani and P.B. Faria, 2018. Meat quality of chicken of different crossings in alternative system. Braz. J. Vet. Anim. Sci., 70: 254-262.
- Wise, R.G. and W.J. Stadelman, 1961. Tenderness of poultry meat: 2. Effect of scalding procedures. Poult. Sci. 40: 1731-1736.
- Motsepe, R., M. Mabelebele, D. Norris, D. Brown, J. Ngambi and M. Ginindza, 2016. Carcass and meat quality characteristics of South African indigenous chickens. Indian J. Anim. Res., 50: 580-587.
- Fulla, S.T. and A.H. Gebreslassie, 2025. Growth and carcass traits comparison of different chicken strains under on-station conditions. Asian J. Biol. Sci., 18: 55-67.
- Ibrahim, D., G. Goshu, W. Esatu and A. Cahaner, 2019. Dual-purpose production of genetically different chicken crossbreeds in Ethiopia. 1. Parent stocks' feed intake, body weight, and reproductive performance. Poult. Sci., 98: 3119-3129.
- Dana, N., E.H. vander Waaij and J.A.M. van Arendonk, 2011. Genetic and phenotypic parameter estimates for body weights and egg production in Horro chicken of Ethiopia. Trop. Anim. Health Prod., 43: 21-28.
- Hailemariam, A., W. Esatu, S. Abegaz, M. Urge, G. Assefa and T. Dessie, 2022. Serum biochemical and meat fatty acid profiles of different chicken genotypes. Open J. Anim. Sci., 12: 287-302.
- Taye, S., G. Goshu and S. Abegaz, 2022. Effect of crossbreeding on growth performance of improved Horro crosses with Koekoek and Kuroiler chicken breeds. Poult. Sci. J., 10: 35-44.
- Hassen, H., F.W.C. Neser, A. de Kock and E. van Marle-Koster, 2009. Study on the genetic diversity of native chickens in Northwest Ethiopia using microsatellite markers. Afr. J. Biotechnol., 80: 1347-1353.
- Abdu, M.A. and A.H. Gebreslassie, 2024. Comparison of economic feasibility of different chicken genotypes under on-station condition. Int. J. Sci. Qual. Anal., 10: 1-9.
- Mueller, S., L. Taddei, D. Albiker, M. Kreuzer, M. Siegrist, R.E. Messikommer and I.D.M. Gangnat, 2020. Growth, carcass, and meat quality of 2 dual-purpose chickens and a layer hybrid grown for 67 or 84D compared with slow-growing broilers. J. Appl. Poult. Res., 29: 185-196.
- Whiting, R.C. and R.K. Jenkins, 1981. Comparison of rabbit, beef and chicken meats for functional properties and frankfurter processing. J. Food Sci., 46: 1693-1696.
- Honikel, K.O., 2009. Oxidative Changes and their Control in Meat and Meat Products. In: Safety of Meat and Processed Meat, Toldrá, F. (Ed.), Springer, New York, ISBN: 978-0-387-89026-5, pp: 313-340.
- Marasinghe, M.G. and K.J. Koehler, 2018. Statistical Data Analysis Using SAS. 2nd Edn., Springer, Cham, Switzerland, ISBN: 978-3-319-69238-8, Pages: 679.
- Kokoszyński, D., A. Wilkanowska, H. Arpášová and C. Hrnčár, 2020. Comparison of some meat quality and liver characteristics in Muscovy and mule ducks. Arch. Anim. Breed., 63: 137-144.
- Jaturasitha, S., A. Kayan and M. Wicke, 2008. Carcass and meat characteristics between Thai village chickens compared with improved layer breeds and their crossbred. Poult. Sci., 51: 283-294.
- Debut, M., C. Berri, E. Baeza, N. Sellier and C. Arnould et al., 2003. Variation of chicken technological meat quality in relation to genotype and preslaughter stress conditions. Poult. Sci., 82: 1829-1838.
- Arslan, E., H. Keskin, M. Garip and C. Ozcan, 2023. The effect of crossbreeding with different breeds on slaughter and carcass characteristics and meat quality in Leghorn hens. S. Afr. J. Anim. Sci., 53: 573-581.
- Wideman, N., C.A. O'Bryan, P.G. Crandall, 2016. Factors affecting poultry meat colour and consumer preferences-A review. World's Poult. Sci. J., 72: 353-366.
- Fletcher, D.L., 2002. Poultry meat quality. World's Poult. Sci. J., 58: 131-145.
- Gálvez, F., R. Domínguez, A. Maggiolino, M. Pateiro and J. Carballo et al., 2020. Meat quality of commercial chickens reared in different production systems: Industrial, range and organic. Ann. Anim. Sci., 20: 263-285.
- Wattanachant, S., 2008. Factors affecting the quality characteristics of Thai indigenous chicken meat. Suranaree J. Sci. Technol., 15: 317-322.
- Weimer, S.L., S. Zuelly, M. Davis, D.M. Karcher and M.A. Erasmus, 2022. Differences in carcass composition and meat quality of conventional and slow-growing broiler chickens raised at 2 stocking densities. Poult. Sci., 101.
- Youssao, I.A.K., I.T. Alkoiret, M. Dahouda, M.N. Assogba and N.D. Idrissou et al., 2012. Comparison of growth performance, carcass characteristics and meat quality of Benin indigenous chickens and Label Rouge (T55×SA51). Afr. J. Biotechnol., 11: 15569-15579.
- Cassandro, M., M. de Marchi, M. Penasa and C. Rizzi, 2015. Carcass characteristics and meat quality traits of the padovana chicken breed, a commercial line, and their cross. Ital. J. Anim. Sci., 14.
- Kalia, S., V.K. Bharti, D. Gogoi, A. Giri and B. Kumar, 2017. Studies on the growth performance of different broiler strains at high altitude and evaluation of probiotic effect on their survivability. Sci. Rep., 7.
How to Cite this paper?
APA-7 Style
Gebreslassie,
A.H. (2025). Quality Trait Evaluation of Thigh Meat in Chicken Genotypes Under On-Station Condition. Asian Journal of Biological Sciences, 18(3), 693-703. https://doi.org/10.3923/ajbs.2025.693.703
ACS Style
Gebreslassie,
A.H. Quality Trait Evaluation of Thigh Meat in Chicken Genotypes Under On-Station Condition. Asian J. Biol. Sci 2025, 18, 693-703. https://doi.org/10.3923/ajbs.2025.693.703
AMA Style
Gebreslassie
AH. Quality Trait Evaluation of Thigh Meat in Chicken Genotypes Under On-Station Condition. Asian Journal of Biological Sciences. 2025; 18(3): 693-703. https://doi.org/10.3923/ajbs.2025.693.703
Chicago/Turabian Style
Gebreslassie, Atsbaha, Hailemariam.
2025. "Quality Trait Evaluation of Thigh Meat in Chicken Genotypes Under On-Station Condition" Asian Journal of Biological Sciences 18, no. 3: 693-703. https://doi.org/10.3923/ajbs.2025.693.703

This work is licensed under a Creative Commons Attribution 4.0 International License.