Molecular Characterization of Trichosanthes cucumerina Using SSR Markers
-
A.N. Osuagwu

Department of Plant Science and Biotechnology, Michael Okpara University of Agriculture, Umudike, Nigeria
C.U. AguoruDepartment of Botany and Environmental Science, University of Agriculture, Makurdi, Nigeria
L.O. OmoiguiDepartment of Plant Breeding and Genetics, University of Agriculture, Makurdi, Nigeria
J.O. OlasanDepartment of Botany and Environmental Science, University of Agriculture, Makurdi, Nigeria
O.I. OnenDepartment of Plant Science and Biotechnology, University of Cross River State, Calabar, Nigeria
| Received 04 Aug, 2025 |
Accepted 10 Oct, 2025 |
Published 31 Dec, 2025 |
Background and Objective: Trichosanthes cucumerina is a neglected and underutilized vegetable valued by traditional communities for food, yet its genetic diversity remains underexplored in Nigeria. This study aimed to assess the genetic diversity of T. cucumerina accessions from four geopolitical zones in Nigeria using simple sequence repeat (SSR) markers, to generate data useful for gene identification, mapping, and molecular breeding to enhance food security. Materials and Methods: Fourteen-day-old seedlings from fourteen accessions collected across four geopolitical zones were analyzed. Genomic DNA was extracted using the SDS method, and seventeen SSR primers were used for amplification. Banding patterns were scored into a binary matrix and analyzed in Minitab 17. Genetic diversity indices, phylogenetic clustering, Principal Component Analysis (PCA), and Analysis of Molecular Variance (AMOVA) were performed. Results: Major allele frequency ranged from 0.3571-0.8571, allele number from 2.000-4.000, gene diversity from 0.2800-0.7245, and polymorphic information content (PIC) from 0.2800-0.6740. A total of 25 alleles were amplified, averaging two per locus. Three primers (CMTM 34, CMTM 9, LSR 015) showed the highest PIC values. Dendrogram analysis grouped the accessions into three clusters, with PCA explaining 80.61% (PC1) and 7.38% (PC2) of the variation. The AMOVA revealed significant genetic differentiation (p<0.001), with 91% of the variation occurring within accessions and 9% among clusters. Conclusion: The study reveals considerable genetic diversity among T. cucumerina accessions in Nigeria, highlighting specific SSR markers with high discriminatory power. These findings provide essential baseline data for molecular breeding and conservation, contributing to the crop’s potential role in enhancing food security.
| Copyright © 2025 Osuagwu et al. This is an open-access article distributed under the Creative Commons Attribution License, which permits unrestricted use, distribution, and reproduction in any medium, provided the original work is properly cited. |
INTRODUCTION
Indigenous people in Nigeria have long used a wide range of plants for food and medicine. About 130 genera and 900 species make up the Cucurbitaceae family, which is known for its great genetic variety1.
The majority of these species are located in tropical and subtropical regions. The plant family is considered economically significant since many of its species generate edible commodities and useful fibers for human consumption2.
Fruit shape and related features exhibit great genetic variety among members of this plant group.
Their distinctive aboveground growth pattern, which encourages a wide range of phenotypic expression2. The snake tomato (Trichosanthes cucumerina), also known as viper gourd or long tomato, is an underutilized crop whose fruit is primarily eaten as a vegetable3,4. In rural Nigerian communities, it is valued for its sweet flavor and deep red endocarp pulp, commonly used in stews when mature. Underutilized plants are species that are not widely available, seldom used, and typically limited to a certain region3. Underutilized crops or plant species are defined as those traditionally cultivated by various communities for purposes such as food, fibre, animal fodder, oil, or medicine5. These species possess significant, yet unexploited, potential for wider applications. Furthermore, recent proposals indicate that numerous species, their varieties, and the associated traditional cultivation knowledge are declining rapidly6.
Morphological studies have been useful in getting information on genetic studies, but this method has limitations because it measures phenotypic characters, which are affected by environmental and climatic factors. Genetic diversity found in species showed a valuable genetic resource for breeding and genetic7,8. Living germplasm collections are important resources for showcasing and conserving genetic and phenotypic diversity and provide novel material for breeding efforts9. Genetic diversity studies using molecular markers are distinguished from morphological analysis because it is not affected by environmental factors. Molecular markers have shown themselves as a powerful tool in the assessment of genetic variation and in pointing out genetic relationships within and among species. Simple sequence repeat, also known as microsatellite in this study, is preferable because it is reproducible, highly polymorphic, codominant, multiallelic, and amplified by PCR. Simple sequence repeats (SSR), which are short, tandemly repeated DNA sequences, are commonly applied in studying genetic relationships among closely related species, as well as in evaluating their cross-species transferability across different genera within the species Cucurbitaceae family10-13.
Research conducted on Cucurbita pepo landraces in KwaZulu-Natal, South Africa, used RAPD and SSR markers. The results showed that the genetic differentiation coefficient between populations ranged from 0.0022 to 0.0100 using the RAPD marker and from 0 to 0.0076 using the SSR marker. Both markers discriminated the landraces well. However, only the RAPD marker could discriminate between landraces based on fruit colour, changes at maturity, and agro-ecological origins. All genetic parameters indicated high genetic diversity in C. pepo landrace14.
Genetic diversity is essential for plant survival and crop improvement, as demonstrated by the application of simple sequence repeat (SSR) markers in genetic studies. For instance, investigations of Cucumis melo landraces in the Xinjiang Uygur Autonomous Region and Zhang et al.15 and Yook et al.16 assessed 69 Miscanthus species accessions using 31 SSR primers, identified genetic similarity coefficients between 0.34 and 0.86. These findings indicate substantial intraspecific variability. Such broad genetic diversity underpins both adaptation to natural environments and the success of crop enhancement initiatives17. Despite widespread acknowledgment of its significance, the genetic resources of this species in Nigeria remain limited. This limitation is attributed to the absence of a national research program and persistent institutional and policy barriers, as reported by Roberts et al.8. Molecular characterization of cucurbits has been carried out on different genera of Cucurbitaceae1,8 using RAPD and SSR. Thus, there is a need to study the diversity of Trichosanthes cucumerina and var anguina in Nigeria. This study aims to characterize landraces of T. cucumerina in Nigeria using simple sequence repeats.
MATERIALS AND METHODS
Viable seeds of snake tomato (Trichosanthes cucumerina L.) ecotypes were sourced and collected from the following locations for the laboratory study as follows (Table 1).
| Table 1: | Sources, ecotypes, and designations of the 14 accessions collected from different locations in Nigeria | |||
| Sr/N | Source location | Ecotype | Designation |
| 1 | Benin, Edo State | Rainforest | V1 |
| 2 | Nasarawa State | Derived savannah | V2 |
| 3 | Oye-Ekiti, Ekiti State | Rainforest | V3 |
| 4 | Ilorin, Kwara State | Guinea savannah | V4 |
| 5 | NHST 0588 | Guinea savannah | V5 |
| 6 | Makurdi, Benue State | Derived savannah | V6 |
| 7 | Rumibekwe, Rivers State | Rainforest | V7 |
| 8 | Ikom, Cross River State | Rainforest | V8 |
| 9 | Oshogbo Osun State | Rainforest | V9 |
| 10 | Ikwuano, Abia State | Rainforest | V10 |
| 11 | Elelenwo-Rivers State | Rainforest | V11 |
| 12 | NAGRAB-00753 | Guinea savannah | V12 |
| 13 | Ukwa, Abia State | Rainforest | V13 |
| 14 | Iberenta, Abia State | Rainforest | V14 |
| Total | 14 |
| Table 2: | Primer sequences (5-3', forward/reverse) of the 17 SSR markers used in PCR reactions with genomic DNA of 14 T. cucumerina L. ecotypes | |||
| Marker name | Forward primer | Reverse primer | References |
| LSR015 | CTTACCTTCACAAAACCCCATC | ACTCTGTTTCGACTCTGCTTCC | Xu et al.19 |
| LSR040 | TTCCATCCAGACCAAACCTATC | CAAAGGCCATAGACAAACACAA | Xu et al.19 |
| LSR056 | TAATAATGCCACTGCACATGGT | AGATGAATCCCAATATCCCAGA | Xu et al.19 |
| LSR063 | AAGAGAGGGGCAGGAAGTAAAT | AGAAAACACACAGTACGCCTCC | Xu et al.19 |
| LSR077 | GACAGATCCTTCTGGGACTTTT | TTCTGCAATAGAGTACGTTGGC | Xu et al.19 |
| LSR112 | CTCTCTATATGTCTAATTCCTCGCC | CAAATTCACAGTTGTTGTCACG | Xu et al.19 |
| CUTC017708 | TGTGATTTGTTGGGCTCTCTGT | ACATGGAAATCCACCTCTTCGT | Gong et al.20 |
| CUTC002749 | GTGGGCTAAGTTCAAATCGTTC | GAACCCAATCTTCTCATTTCCA | Gong et al.20 |
| CUTC046645 | CCCTCGGTAGCAATTTTGTAGT | TTTGGTGGGAGTGATACTGATG | Gong et al.20 |
| CUTC009607 | CAAAACTGCCCATGACCACTAC | CTTTCTACCCCAACCCCACAT | Gong et al.20 |
| CMTP46 | TTCCCTTCTGCAGAGATGCT | CCATGCGCATAATTGTATCG | Blanca et al.21 |
| CMTP142 | TCAACCAAGTGCCAATCTCA | ACTGATCCACCGACTGATACG | Blanca et al.21 |
| CMTM 34 | TGAAACTACAACTACATGACCTTGG | TGGGTTGGTAGACTTGTAGTTGA | |
| CMTM9 | GCCCAGAAGACAAAAGTTCG | TTTTTGTGTGCGTGTGTGG | |
| CMTM54 | GTGTGGATGCAAATGGTGAG | GGGAATCGAGGGTTTTGAAT | |
| CMTM172 | CATTGGAGTGCGTGAAATTG | GTGAGTGGTCAAAGGCATT | |
| CMTP66 | ACGACATGAGGGAAGATTCG | TTCAATGCCATTCGCCTAC |
The study was carried out on the 8th June, 2021-3rd March, 2022 in the Molecular Biology Laboratory of Michael Okpara University of Agriculture, Umudike, Abia State, Nigeria. Old modified method of the SDS DNA extraction was used18. The sampled tubes were centrifuged at 1000 rpm for 10 min, and transferred supernatant was transferred into freshly labelled tubes. About 2/3 volume of ice-cold Isopropanol was added, mixed gently, and incubated in -80°C for 15 min to precipitate the DNA. The tubes were centrifuged at 1000 rpm for 10 min. The supernatant was decanted until the last drop 400 μL of 70% ethanol was added to wash the DNA pellet. The sampled tubes were centrifuged at 1000 rpm for 10 min. The supernatant was decanted until the last drop, and air-dried the pellet. About 60 μL of ultra pure water or low salt TE to re-suspend the DNA, 2 μL of RNase was added and incubated in 37°C for 30-40 min.
Agarose gel electrophoresis: The diversity analysis was carried out using 17 SSR primers from Inqaba Biotec West Africa Ltd., in South Africa synthesized the primers (Table 2). For successful amplification, PCR products were first run on a 2% agarose gel and visualized with ethidium bromide. Non-resolved products were then resolved on a 6% non-denaturing polyacrylamide gel (29:1, acrylamide: bis), visualized under UV lights in the presence of the Safe View TM DNA stains (Applied Biological Materials Inc., Richmond, BC, Canada), and images were captured.
Data analysis: For data analysis, the amplified products in the gel pictures were manually scored in a binary format, with ‘1' and ‘0' representing the presence and absence of the amplicons, respectively, for all accessions.
Statistical analysis: Power Marker version 3.25 was used to calculate the number of alleles per marker, the major allele frequency, gene diversity, and the polymorphic information content (PIC) value for each locus)22. The genetic analysis was done with GenAlEx23.
RESULTS
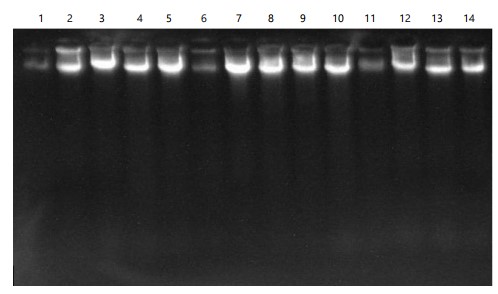
The gel image presented in Fig. 1 illustrates the integrity and band clarity of genomic DNA extracted from the Trichosanthes cucumerina snake gourd samples. The distinct and well-defined bands observed confirm that the extraction procedure yielded high-quality DNA with minimal degradation or smearing. This level of band resolution is indicative of sufficient purity and concentration, confirming the suitability of the DNA samples for subsequent molecular analyses, including PCR amplification and marker-based characterization.
The nanodrop readings from the PCR gel images. The nucleic acid images varied from -1884.1-8419. 5 ng/μL at 260/280 bp from 1.91-197 in Table 3.
In Table 4 marker major allele frequency ranges from 0.3571-0.8571 with a mean of 0.611. The allele number of the marker was within the range of 2.0000-4.0000 with a mean of 2.4444. The availability of the marker was 1.000. The gene diversity of the marker ranges was 0.2449-0.7245 with a mean of 0.4819.
| Table 3: | UV absorbance-based quantification and purity assessment of DNA using nanodrops | |||
| Sr/N | Sample ID | Nucleic acid | Unit | 260/280 |
| 1 | Benin Edo State | 2272 | ng/μL | 1.91 |
| 2 | Nassarawa State | 6248.5 | ng/μL | 1.97 |
| 3 | Oye Ekiti, Ekiti State | 8122 | ng/μL | 1.95 |
| 4 | Ilorin Kwara | 8419.5 | ng/μL | 1.97 |
| 5 | NHST 0588 | 5639 | ng/μL | 1.95 |
| 6 | Makurdi Benue State | 4503.8 | ng/μL | 1.94 |
| 7 | Rumibekwe River State | 8513.7 | ng/μL | 1.94 |
| 8 | Ikom Cross River | -1844.1 | ng/μL | 1.94 |
| 9 | Oshogbo Osun State | 6202.5 | ng/μL | 1.91 |
| 10 | Ikwuano Abia State | 7241.4 | ng/μL | 1.96 |
| 11 | Elelenwo River State | 5546.9 | ng/μL | 1.95 |
| 12 | NAGRAB 00753 | 7723.6 | ng/μL | 1.96 |
| 13 | Ukwa Abia State | 6509.7 | ng/μL | 1.94 |
| 14 | Iberenta Abia | 6315.4 | ng/μL | 1.95 |
|
|
Polymorphism information centre (PIC) ranges from (0.2149-0.6740), and the mean was 0.3987. A total of 25 alleles were amplified, with an average of 2 markers per allele. The average gene diversity is 0.48, while the gene diversity ranges from 0.24 to 0.72. The average polymorphic information content (PIC) value for each locus was 0.40 and varied from 0.21 to 0.67, indicating the level of allele variation among the species. Primer CMTM 34 has the highest allele number and the highest PIC value among the SSRs.
|
| Table 4: | Markers, major allele frequency, allele number, gene diversity, polymorphisms information centre (PIC) | |||
| Marker | Major allele frequency | Allele no. | Gene diversity | PIC |
| CMTM 54 | 0.6429 | 2 | 0.4592 | 0.3538 |
| CMTM 34 | 0.3571 | 4 | 0.7245 | 0.674 |
| CMTP 46 | 0.6429 | 2 | 0.4592 | 0.3538 |
| LSR015 | 0.5 | 3 | 0.5612 | 0.465 |
| CMTM 9 | 0.5 | 3 | 0.602 | 0.5229 |
| CMTM 172 | 0.7857 | 2 | 0.3367 | 0.28 |
| CMTM 142 | 0.6429 | 2 | 0.4592 | 0.3538 |
| CUTCO02749 | 0.8571 | 2 | 0.2449 | 0.2149 |
| CUTCO46645 | 0.5714 | 2 | 0.4898 | 0.3698 |
| Mean | 0.6111 | 2.4444 | 0.4819 | 0.3987 |
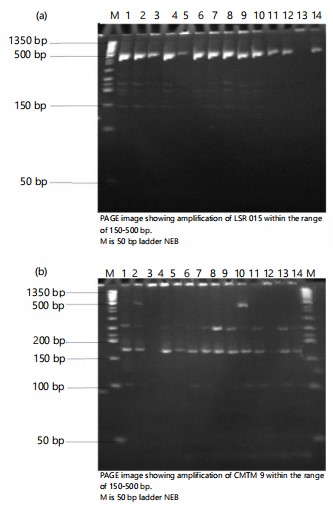
Polyacrylamide gel electrophoresis (Page) of T. cucumerina genomic DNA amplified with LSR015 primer showing molecular weight marker at 50 bp. The LSR015 is within the range of 150-500 bp.
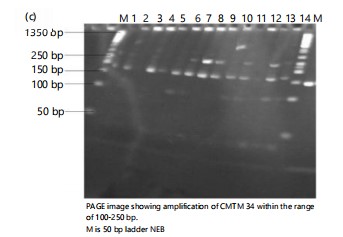
The selected gel made from the study is shown in Fig. 2a-c. All the primers give good DNA amplification of fourteen accessions of T. cucumerina. The result depends on the number of bands on the SSR primer and the T. cucumerina location. The following primes were determined as follows CMTM 34 (Kadarko, Nassarawa), CMTM 9 (Ikom, Cross River), and LSR 015 (Rumibekwe, Rivers). The polymorphic information content revealed that the primer with the highest PIC was CMTM 34(0.6740) followed by CMTM 9 (0.5229) and LSR 015 (0.4650).
|
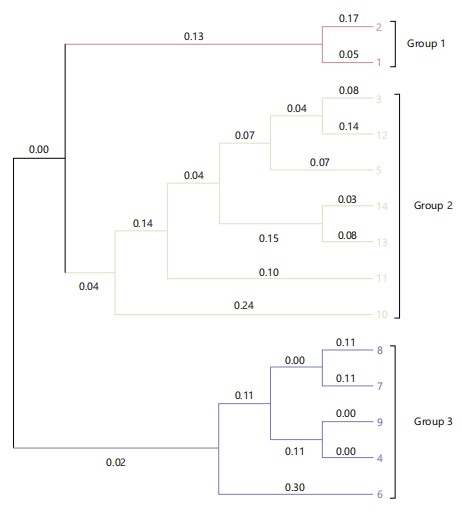
Phylogenetic assessment: The dendrogram was constructed using Neighbour-joining. The analysis divided the accessions into three major groups, with group two having the highest number of accessions. This was followed by group three, while group one had the lowest number of accessions grouped together (Fig. 3). There were three cluster groups in the sequence dendrogram. Benin and Kadarko accessions were closely related to each other.
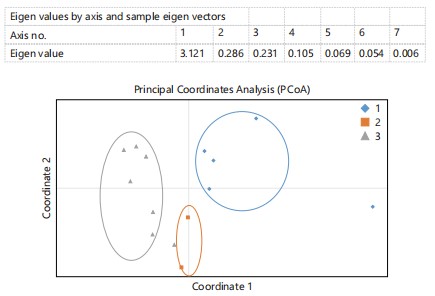
Principal component analysis: The Principal Component Analysis (PCA) clustered the lines into three subgroups. The first principal component (PCI) explained 80.61% of the variation, and PC2 explained 7.38%. Figure 4: AMOVA showed significant genetic differentiation within individuals (p<0.001), 91% of the total genetic variations were due to differences within the lines, while the remaining 9% was observed among clusters. The eigenvalue was found to be more than one in eigenvalue 1, while eigenvalue 2-7 was less than less. This implies all the ecotypes are positively related to one another.
DISCUSSION
The marker major allele frequency ranges from 0.3571-0.8571 with a mean of 0.611. The allele number of the marker was within the range of 2.000-4.000 with a mean range of 2.444. The availability of the marker was 1.000. The gene diversity of the marker ranged from 0.2449-0.7245, with a mean of 0.4189. Polymorphism information centre (PIC) ranged from (0.2149-0.6740) with a mean of 0.3987. This observation is consistent with the findings of an old study of Merheb et al.24, which characterized snake melon using 10 SSR markers and reported fifty-six distinct alleles, with an average of 5.6 alleles per locus. The polymorphism information content (PIC) of simple sequence repeat (SSR) markers ranged from 0.06-0.84, with an average of 0.38. Consistent allele richness across related studies demonstrates the effectiveness of SSR markers in detecting genetic variation within Cucurbitaceae species and supports their reliability for assessing genetic diversity in snake gourd populations. Similarly, a study of Dar et al.13 reported on the genetic diversity and population structure of Cucumis sativus L. using SSR markers, where allele frequencies ranged from 0.215 to 0.561 with an average of 0.403, and PIC values varied from 0.158 to 0.4985 with a mean of 0.333. In a related study of Liu et al.25 investigated genetic diversity and relationships among 38 Chinese and 28 Russian accessions of Cucurbita and 10 Chinese accessions of Curcubita pepo with thirty-five simple sequence repeats (SSR) markers. A total of 85 DNA fragments were amplified, of which 85.89% were polymorphic. This result indicates a high level of genetic diversity within the population. These findings are consistent with those of a previous study that evaluated the genetic diversity and phylogenetic relationships of Iranian cucurbits using inter-sample sequence repeat (ISSR) markers. In that study, 17 primers were tested, and 11 produced scorable bands, resulting in 263 polymorphic bands. The average polymorphism information content (PIC) value was 0.327, further confirming significant genetic variability within cucurbit species.
Also Esmailnia et al.26 the genetic diversity of Brassica oleracea using simple sequence repeat (SSR) from twenty-five accessions and found 47 alleles; the observed heterozygosity (0.6991, average value of fixation indices (F) was negative, which showed excess of heterozygotes, and polymorphic information content (PIC) values of SSR loci ranged from 0.27-0.66, with an average of 0.571.
Phylogenetic analysis based on the dendrogram divided the accessions into three major clusters, with group two containing the highest number of accessions, followed by group three, while group one had the least. This clustering pattern reflects relatively low genetic diversity among the analyzed Trichosanthes cucumerina landraces. Comparable patterns have been reported in previous studies of Peakall and Smouse23, such as those involving Cucumis melo subsp. melo L. var. flexusus, where accessions were categorized into five distinct clusters, indicating high genetic variability. Similarly, research utilizing simple sequence repeat (SSR) markers in sweet potatoes showed moderate genetic diversity, with a similarity coefficient of 0.4927. On the other hand, a study on Chinese watermelon ecotypes and germplasm from other countries grouped all cultigens into six clusters, with genetic similarity coefficients among Chinese ecotypes ranging from 0.37 to 0.99. Except a wild relative, most of the watermelon ecotypes exhibited close genetic relationships28. Apart from a wild watermelon relative, the majority of ecotypes were genetically similar, while the genetic distance among non-Chinese cultigens varied between 0.67 and 0.91.
The principal component analysis (PCA) clustered the lines into three subgroups. This is in agreement with the previous work of Liu et al.25 reported the least distance was observed between two species of Cucumis L. genus with a genetic similarity value of 64.34%, while the highest genetic distances were observed between Cucumis species L. and Cucurbita species L. with a genetic similarity value of 20.71%. This tends to agree with the work of Gong et al.11, who reported genetic relationship and evolution in Cucurbita pepo using simple sequence repeat (SSR) results obtained, showing three clusters distinguishing pepo, texana, and fraterna. The accessions indicated there was no crossing between subspecies. The genetic diversity and population structure of cucumber (Cucumis sativus L.) and observed the separation of accessions into three groups using Principal Component Analysis (PCA) and a phylogenetic tree, which corroborates this work of Lv et al.29. Reports of Forrester et al.30 on the genetic diversity of Bambara groundnut (Vigna subterranea (L) verdc) landraces in Kenya using microsatellite markers and observed 24 alleles, which were revealed with a mean of 2, and gene diversity values averaged 0.28 and 0.35, respectively, indicating low genetic diversity. Jaccard’s similarity coefficient from the simple sequence repeat (SSR) ranged from 0.08-1.16 to indicate the genetic distance among the landraces. The phylogenetic tree of 105 accessions of Bambara groundnut revealed three clusters. The Principal Coordinate Analysis (PCoA) revealed that the first three axes accounted for 84.3% of the total variation, with each axis explaining 63.58, 12.21, and 8.24% variation in that order. This is in agreement with the findings of this work.
This study assessed the genetic diversity of Trichosanthes cucumerina in Nigeria using SSR markers; however, its scope was constrained by a limited number of accessions, restricted geographical coverage, and a relatively small set of SSR loci. Potential sampling bias and the absence of phenotypic data limited the capacity to link molecular variation to agronomic traits. Additionally, the work reflects a single collection period, omitting temporary variability.
Future research should expand germplasm sampling to cover all agro-ecological zones, employ a larger and more diverse marker (including SNP), and integrate morphological and agronomic evaluations to identify marker-trait associations useful for breeding programs. Longitudinal studies capturing seasonal and multi-year variation would provide deeper insights. Comparative genetic analysis between Nigerian germplasm and populations from other parts of Africa and Asia could further elucidate evolutionary relationships and domestication pathways.
CONCLUSION
Seventeen primers were used for this study; three primers distinguished themselves. They are CMTM 34 (Kadarko, Nassarawa), CMTM 9 (Ikom, Cross River) and LSR 015 (Rumibekwe, Rivers) respectively. The polymorphic information content revealed that the primer with the highest PIC was CMTM 34 (0.6740) followed by CMTM 9 (0.5229) and LSR 015 (0.4650). CMTM 34 can be recommended as a primer for snake gourd studies using a simple sequence repeat marker. The present study can be useful for gene identification, gene mapping, and molecular breeding of T. cucumerina from four geopolitical zones in Nigeria for food security.
SIGNIFICANCE STATEMENT
This study discovered the considerable genetic diversity of Trichosanthes cucumerina accessions across Nigeria, which can be beneficial for gene identification, mapping, and molecular breeding to improve the crop’s productivity and adaptability. The identification of SSR markers with high discriminatory power provides a reliable tool for assessing genetic relationships and guiding conservation strategies. By revealing the extent of variation within and among accessions, the study highlights the untapped potential of this neglected and underutilized vegetable for food and nutritional security. Importantly, this study will help researchers to uncover the critical areas of genetic diversity and molecular breeding that many researchers were not able to explore. Thus, a new theory on the crop’s improvement and utilization may be arrived at.
REFERENCES
- Adeyemo, O.A., S.R. Adegoke, D.J. Oladapo, C.C. Amaghereonu and A.E. Thomas et al., 2020. Transferability of SSR markers used for assessment of genetic relationship in five species/genera in cucurbitaceae. Egypt. J. Bot., 60: 275-286.
- Bisognin, D.A., 2002. Origin and evolution of cultivated cucurbits. Cienc. Rural, 32: 715-723.
- Liyanage, R., H. Nadeeshani, C. Jayathilake, R. Visvanathan and S. Wimalasiri, 2016. Comparative analysis of nutritional and bioactive properties of aerial parts of snake gourd (Trichosanthes cucumerina Linn.). Int. J. Food Sci., 2016.
- Badejo, A.A., A.P. Adebowale and V.N. Enujiugha, 2016. Changes in nutrient composition, antioxidant properties, and enzymes activities of snake tomato (Trichosanthes cucumerina) during ripening. Prev. Nutr. Food Sci., 21: 90-96.
- Arora, R.K., 2014. Diversity in Underutilized Plant Species-An Asia-Pacific Perspective 1938. Bioversity International, New Delhi, India, ISBN: 978-92-9255-007-3, Pages: 234.
- Padulosi, S., J. Thompson and P. Rudebjer, 2013. Fighting Poverty, Hunger and Malnutrition with Neglected and Underutilized Species: Needs, Challenges and the Way Forward. Bioversity International, Rome, Italy, ISBN: 978-92-9043-941-7, Pages: 60.
- Klich, M.A., 2002. Identification of Common Aspergillus Species. ASM Press, Washington, D.C., USA, ISBN: 9789070351465, Pages: 116.
- Roberts, E.M.I., I.O. Agbagwa and B.E. Okoli, 2018. Genetic diversity and RAPD-based DNA fingerprinting of some members of the Cucurbitaceae in Nigeria. J. Adv. Biol. Biotechnol., 17.
- Migicovsky, Z., E. Warschefsky, L.L. Klein and A.J. Miller, 2019. Using living germplasm collections to characterize, improve, and conserve woody perennials. Crop Sci., 59: 2365-2380.
- Ajenifujah-Solebo, S.O.A., I. Ingelbrecht, N.A. Isu, O. Olorode, G.I.B. Obioh and S. Nnadi, 2018. Molecular characterization of three cultivars of tomato (Lycopersicon esculentum L.) in South-West Nigeria using SSR markers. Int. J. Environ. Agric. Biotechnol., 3: 1401-1408.
- Gong, L., H.S. Paris, M.H. Nee, G. Stift, M. Pachner, J. Vollmann and T. Lelley, 2012. Genetic relationships and evolution in Cucurbita pepo (pumpkin, squash, gourd) as revealed by simple sequence repeat polymorphisms. Theor. Appl. Genet., 124: 875-891.
- Sheng, Y., F. Luan, F. Zhang and A.R. Davis, 2012. Genetic diversity within Chinese watermelon ecotypes compared with germplasm from other countries. J. Am. Soc. Hortic. Sci., 137: 144-151.
- Dar, A.A., R. Mahajan, P. Lay and S. Sharma, 2017. Genetic diversity and population structure of Cucumis sativus L. by using SSR markers. 3 Biotech, 7.
- Ntuli, N.R., P.B. Tongoona and A.M. Zobolo, 2015. Genetic diversity in Cucurbita pepo landraces revealed by RAPD and SSR markers. Sci. Hortic., 189: 192-200.
- Zhang, Y., X. Fan, Y. Aierken, X. Ma, H. Yi and M. Wu, 2017. Genetic diversity of melon landraces (Cucumis melo L.) in the Xinjiang Uygur Autonomous Region on the basis of simple sequence repeat markers. Genet. Resour. Crop E, 64: 1023-1035.
- Yook, M.J., S.H. Lim, J.S. Song, J.W. Kim and C.J. Zhang et al., 2014. Assessment of genetic diversity of Korean Miscanthus using morphological traits and SSR markers. Biomass Bioenergy, 66: 81-92.
- Bhandari, H.R., A.N. Bhanu, K. Srivastava, M.N. Singh, Shreya and A. Hemantaranjan, 2017. Assessment of genetic diversity in crop plants-An overview. Adv. Plants Agric. Res., 7: 279-286.
- Dellaporta, S.L., J. Wood and J.B. Hicks, 1983. A plant DNA minipreparation: Version II. Plant Mol. Biol. Rep., 1: 19-21.
- Xu, P., X. Wu, J. Luo, B. Wang and Y. Liu et al., 2011. Partial sequencing of the bottle gourd genome reveals markers useful for phylogenetic analysis and breeding. BMC Genomics, 12.
- Gong, L., G. Stift, R. Kofler, M. Pachner and T. Lelley, 2008. Microsatellites for the genus Cucurbita and an SSR-based genetic linkage map of Cucurbita pepo L. Theor. Appl. Genet., 117: 37-48.
- Blanca, J., J. Cañizares, C. Roig, P. Ziarsolo, F. Nuez and B. Picó, 2011. Transcriptome characterization and high throughput SSRs and SNPs discovery in Cucurbita pepo (Cucurbitaceae). BMC Genomics, 12.
- Liu, K. and S.V. Muse, 2005. PowerMarker: An integrated analysis environment for genetic marker analysis. Bioinformatics, 21: 2128-2129.
- Peakall, R. and P.E. Smouse, 2012. GenAlEx 6.5: Genetic analysis in Excel. Population genetic software for teaching and research-an update. Bioinformatics, 28: 2537-2539.
- Merheb, J., M. Pawełkowicz, F. Branca, H. Bolibok-Brągoszewska, A. Skarzyńska, W. Pląder and L. Chalak, 2020. Characterization of Lebanese germplasm of snake melon (Cucumis melo subsp. melo var. flexuosus) using morphological traits and SSR markers. Agronomy, 10.
- Liu, C., Y. Ge, D.J. Wang, X. Li, X.X. Yang, C.S. Cui and S.P. Qu, 2013. Morphological and molecular diversity in a germplasm collection of seed pumpkin. Sci. Hortic., 154: 8-16.
- Esmailnia, E., M. Arefrad, S. Shabani, M. Karimi, F. Vafadar and A. Dehestani, 2015. Genetic diversity and phylogenetic relationship of Iranian indigenous cucurbits investigated by Inter Simple Sequence Repeat (ISSR) markers. Biharean Biologist, 9: 47-54.
- El-Esawi, M.A., K. Germaine, P. Bourke and R. Malone, 2016. Genetic diversity and population structure of Brassica oleracea germplasm in Ireland using SSR markers. C.R. Biol., 339: 133-140.
- Koussao, S., V. Gracen, I. Asante, E.Y. Danquah and J.T. Ouedraogo et al., 2014. Diversity analysis of sweet potato (Ipomoea batatas [L.] Lam) germplasm from Burkina Faso using morphological and simple sequence repeats markers. Afr. J. Biotechnol., 13: 729-742.
- Lv, J., J. Qi, Q. Shi, D. Shen and S. Zhang et al., 2012. Genetic diversity and population structure of cucumber (Cucumis sativus L.). PLoS ONE, 7.
- Forrester, O.O., E.O. Maurice, W. Victor, O.O. James, K. Laura and K. Paul, 2015. Genetic diversity of Bambara groundnut (Vigna subterranea (L.) verdc.) landraces in Kenya using microsatellite markers. Afr. J. Biotechnol., 14: 283-291.
How to Cite this paper?
APA-7 Style
Osuagwu,
A., Aguoru,
C., Omoigui,
L., Olasan,
J., Onen,
O. (2025). Molecular Characterization of Trichosanthes cucumerina Using SSR Markers. Asian Journal of Biological Sciences, 18(4), 904-913. https://doi.org/10.3923/ajbs.2025.904.913
ACS Style
Osuagwu,
A.; Aguoru,
C.; Omoigui,
L.; Olasan,
J.; Onen,
O. Molecular Characterization of Trichosanthes cucumerina Using SSR Markers. Asian J. Biol. Sci 2025, 18, 904-913. https://doi.org/10.3923/ajbs.2025.904.913
AMA Style
Osuagwu
A, Aguoru
C, Omoigui
L, Olasan
J, Onen
O. Molecular Characterization of Trichosanthes cucumerina Using SSR Markers. Asian Journal of Biological Sciences. 2025; 18(4): 904-913. https://doi.org/10.3923/ajbs.2025.904.913
Chicago/Turabian Style
Osuagwu, A.N., C.U. Aguoru, L.O. Omoigui, J.O. Olasan, and O.I. Onen.
2025. "Molecular Characterization of Trichosanthes cucumerina Using SSR Markers" Asian Journal of Biological Sciences 18, no. 4: 904-913. https://doi.org/10.3923/ajbs.2025.904.913

This work is licensed under a Creative Commons Attribution 4.0 International License.