Evaluation of Yield Indices and Identification of Yield Responsive Genes (GN1a and GS3) of Selected Rice Genotypes
-
Bara’u Yahaya
Department of Biology, Usmanu Danfodiyo University, Sokoto, Nigeria
Abubakar Muhammad GumiDepartment of Plant Science, Usmanu Danfodiyo University, Sokoto, Nigeria
Muhammad Abdullah YahayaDepartment of Zoology, Usmanu Danfodiyo University, Sokoto, Nigeria
Abubakar Adamu AlieroDepartment of Plant Science, Usmanu Danfodiyo University, Sokoto, Nigeria
Andrew OnuDepartment of Biochemistry, Usmanu Danfodiyo University, Sokoto, Nigeria
Abdulkadir Shehu

Department of Biological Sciences, Sokoto State University, Sokoto, NIgeria
| Received 02 Oct, 2023 |
Accepted 24 May, 2024 |
Published 31 Dec, 2024 |
Background and Objective: Rice is consumed by more than fifty percent of the world’s population, especially in developing countries. This research aimed at evaluation of yield indices and identification of yield responsive genes (GN1a and GS3) of selected rice genotypes. Materials and Methods: Ten rice genotypes was obtained from Maslaha seeds limited Gusau. The seeds were sown on February 3rd and harvested on 22nd June, 2023. The Data collected on plant height, tiller number, number of panicles, panicle length, panicle weight and days to 50% flowering. The genomic DNA of the rice genotypes was extracted using a standard DNA extraction Kit (Plant/Seed Miniprep kit). The Data collected was subjected to One-way Analysis of Variance (ANOVA) using Statistical Analysis System (SAS Version 9.4). Results: The results shows that significant differences (p<0.05) exist amongst genotypes for plant height at maturity with Maikwalli recorded the tallest plants while Danruwa had the shortest plant height. Number of tiller counted were significantly different (p<0.05) among the genotypes such that FARO60 produced the highest number of tillers compared to Maikwalli which produced the lowest tillers among all the entries. The presence of GN1a and GS3 genes was revealed by PCR products in the ten rice cultivars tested. In this study, all the ten genotypes evaluated showed better grain characteristics and germination. Conclusion: The FARO60, Maikwalli, Bvfort and Kamrun accessions proved to be the best in terms of grain characteristics while Danruwa, FARO44, FARO60 and Kamrun proved to have the best yield. This study recommends that genotypes such as Danruwa, FARO44 and Maikwali which yielded the first appearance could be subjected to further trial to ascertain their level of performance.
| Copyright © 2024 Yahaya et al. This is an open-access article distributed under the Creative Commons Attribution License, which permits unrestricted use, distribution, and reproduction in any medium, provided the original work is properly cited. |
INTRODUCTION
Rice (Oryza) is a member of the family Graminae (formerly Poceae), sub family Oryzoidae and is consumed by more than half of the world’s population especially in developing countries. Rice is one of the significant cereal commodities for the world’s population1. Under favorable conditions it can grow for more than a year are well adapted to aquatic habitats. Rice seeds are the most important part of the plant. Rice leaves are flattened and elongated with spikelets bearing flowers that are largely self- pollinating and produce monocotyledonous seeds. The seeds are eaten or used for brewing. The husks can be used as substrate for mushroom growing, mulching, fuel, animal feeds and animal beddings. Rice has several varieties which require a wide range of environmental growth requirements ranging from rain-fed to irrigated agro ecological systems. Rice is a nutritional staple food providing 20% of the calories and 15% of proteins consumed by the world‘s population2.
West Africa remains the hub of rice production in Sub-Saharan Africa but the shortfall in rice production has increased significantly as consumption rises at a rate well above that of production growth. In 2006, paddy rice production in Sub-Saharan Africa was estimated at 14.2 million tones. Because of the reduction in rice production area, the only potential way to increase rice production is to improve rice grain yield per unit area3. Thus, many strategies have been developed to increase rice varieties. Identification of genes contributing to higher yield, disease and pest resistance, salinity, temperature and drought tolerance from wild weedy and land races in rice are possible if the selection strategy of the parental lines shifts from looking for the phenotype to looking for the genes with the aid of genetic linkage maps and molecular markers. Rice grain yield is a quantitative polygenic trait with a highly environment influenced4. Identification of suitable genotypes containing these agronomic traits for grain yield determination should be the first critical step in breeding high yield hybrid rice for breeders, many QTLS related to rice grain yield were identified recently. Grain number 1a (GN1a), the first gene to be isolated that controls rice grain number reported by Ashikari et al.5. Grain size 3 (GS3) was the first major gene to be isolated that determine rice grain size6, then grain weight and width2 (GW2) that influences rice grain width and weight7 and grain incomplete filling 1 (GIF1) that regulates rice grain filling8. To date, a number of other grain yield related genes have been reported in rice genotypes such as dense and erect protein 1 (DEP1) that determines rice panicle architecture9-11, the Osspl14 that promotes panicle branching and higher grain yield in rice12.
The Gs2, Gs5 and Gs6 that regulates grain size13-15, DST16 and Osspl13/Glw7 that regulates length of grains17. Increasing rice production can be fully utilized with various gene pool resources and its appropriate environment to achieved desirable high yields and some stress tolerance. The improvement of the yield of required information related to the combination of parental abilities and gene action involved in the expression of maturity and morphological characteristics of plants18. The selection of assorted parents for hybridization must therefore be based on the ability of the different parental lines to combine. Globally, improving the quantity and quality of rice grain has been approached to solve several problems among the world population such as decreasing the number of hidden hunger and malnutrition19.
Morphological traits have been used to assess the genetic variation and relationships among populations of rice20,21. It is regarded as the primary step in the classification and evaluation of germplasm22. These qualitative characters are crucial for plant description and are influenced by consumer preference, socio-economic scenario and natural selection. Several morphological characters are the major determining factors of rice grain yield including the number of panicles per hill, the number of filled grains per panicle and the weight of filled grain per hill23,24. This research aimed at evaluating the yield attributes and identification of GN1a and GS3 genes in selected rice genotypes to determine high-yielding genotypes. The objectives of the study are todetermine yield attributes of the selected rice genotypes and identify and amplify the yield responsive genes (GN1a and GS3) of the selected rice genotypes using Polymerase Chain Reaction (PCR).
MATERIALS AND METHODS
Study area: This research work was carried out in Plant Physiology Laboratory and Biological garden of Usmanu Danfodiyo University and the study was carried out from February, 2022 to June, 2023. Sokoto is located at the Latitude of 13°12'98'N, Longitude of 5°20'36'E and Altitude of 302 m above sea level. Sokoto is located in the North West of Nigeria, between Latitudes of 13°4'07' North and Longitudes of 05°14'49' east and above 265 m the sea level. The State accounts for 2.3% of Nigeria’s total population. Situated in the North Western corner of Nigeria, Sokoto State territory occupies 25,973 km2. The state has an estimated population of about 6, 391000 people as of 2023 with 95.9 persons per km2 and 3% growth rate annually25.
Plant materials and origin of rice genotypes: A total of ten rice genotypes including four improved (high yielding) varieties and six landraces obtained from Maslaha seeds limited Gusau, Zamfara State. The improved rice genotype samples included: FARO44, FARO59, FARO60 and FARO67. The landraces are Jamila, Dan-Ruwa, Bvfort, Fanjim, Kamrun and Mai Kwalli as shown in Table 1. The seeds were stored in 9×4 cm brown envelops that allowed for aeration and stored in refrigerator (4°C) before used.
Seed multiplication: The seeds of the selected rice genotypes (10 entries) were sown on February 3rd, 2023 and harvested on 22nd June, 2023. The seed multiplication was carried out using 1×1 m plastic trays in the Biological Garden of UDUS, Sokoto using a Completely Randomized Design (CRD) with three replicates, each of the replicates containing 5 seeds and after germination 4 were removed. Soils of the experimental site were sampled at 15 cm depth and analyzed for Physico-chemical characteristics to reveal nutrient availability.
At maturity, panicles were hand-harvested and manually thrashed to obtain paddy26,27. The crop was harvested when the grains were hard and turning yellow/ brownish 30-45 days after flowering or a month after 50% flowering. Paddies were dried in the sun to 14% and below moisture content, put in large envelopes and stored at room temperature for 45 days before determining grain characteristics26. The seed assessment was carried out in the Physiology Laboratory, Department of Biological Sciences, Usmanu Danfodiyo University, Sokoto, while seed germination and viability test was done in the Biological Garden, (UDUS).
Data collection: The plant height (cm) was measured from soil surface to tip of the plant at reproductive stage using the meter rule, tiller number was obtained by counting the number of tillers per plant randomly per plot manually with hand and averaged across replications for each genotypes during the maturity stage (when the plant started flowering), the total number of panicles was counted and recorded at the maturity stage before harvest, the extent to which the panicle is exerted above the flag leaf sheath and it was score using the scale of 1-9 as described by Ishimaru et al.26.
| Table 1: | Rice genotypes and their place of collections | |||
| Accessions | Ecotypes | Place of collection |
| Bvfort | Landrace | Kamrun Bajju |
| Dan Ruwa | Landrace | Kamrun Bajju |
| Fanjim | Landrace | Kamrun Bajju |
| Jamila | Landrace | Maslaha, Gusau |
| Kamrun | Landrace | Kamrun Bajju |
| Maikwalli | Landrace | Maslaha, Gusau |
| FARO44 | Released | Maslaha, Gusau |
| FARO59 | Released | Maslaha, Gusau |
| FARO60 | Released | Maslaha, Gusau |
| FARO67 | Released | Maslaha, Gusau |
1-Enclosed (panicle is partly or completely enclosed within the leaf sheath of the flag leaf blade), 3-Partly exerted (panicle base is seen slightly beneath the collar of the flag leaf blade), 5-Just exerted (panicle base coincides with the collar of the flag leaf blade), 7-Moderately well exerted (panicle base is seen above the collar of the flag leaf blade) and 9-Well exerted (panicle base is seen well above the collar of the flag leaf blade). The panicle length was measured from the base of the panicle to the tip. A total of five panicles were measured from each entry, panicles weight were obtained from harvested samples of genotypes and weighed on a balanced scale to determine the weight in grams and days to 50% flowering were recorded when half of the plant population started flowering.
Seed germination for DNA assays: Ten seeds of each genotype were germinated in sterilized beakers and paper towel under laboratory conditions. Prior to germination, laboratory bench was surface clean with 70 % ethanol to avoid risk of contamination. After germination, 10 days old seedlings were used for DNA isolation.
Extraction of genomic DNA: The genomic DNA of the rice genotypes was extracted using a standard DNA extraction Kit (Plant/Seed Miniprep kit) according to manufacturer’s instruction. The beta-mercaptoethanol was added to the genomic lysis buffer to a dilution of 0.5% (v/v) i.e., 250 μL per 50 mL or 500 μL per 100 mL for optimal performance. The finely cut rice samples (~150 mg) were transferred to the Lysis Tube (2.0 mm) containing 750 μL Bashing Bead Buffer and processed at maximum speed for ≥5 min. As 800 μL was transferred to a column in a collection tube and centrifuge at 10,000xg for 1 min. The 200 μL DNA pre-wash buffer was added to the column in a new collection tube and centrifuged at 10,000xg for 1 min. The 500 μL g-DNA wash buffer was added to the column and centrifuge at 10,000xg for 1 min, column was transferred to a clean 1.5 mL microcentrifuge tube and add 100 μL (50 μL minimum) DNA Elution buffer was directly to the column matrix centrifuge at 10,000xg for 30 sec to elute the DNA. Placed a filter in a clean collection tube and added 600 μL prep solution centrifuge at 8000xg for 3 min. The eluted DNA was transfer to a prepared filter in a clean 1.5 mL micro centrifuge tube and centrifuged at exactly 16000xg for 3 min.
Primers design: The forward and reverse primers of the selected genes were designed manually using VECTOR NTI (Version 11.5 Advanced) Software and the thermodynamic properties of each primer were checked using the default parameter settings of the software as shown in Table 2.
Amplification of GN1a and GS3 using PCR: The PCR reaction was set using a total of 40 μL reaction mixture containing 4 μL 10X dream taq green buffer, 1.0 μL of dNTPs, 2.0 μL of each primer, 0.4 μL of dream Taq total nucleic acid polymerase, 2 μL total nucleic acid template and 28.6 μL of molecular grade water. Thermal-cycling was performed in a super cycler programmed as follows: 95°C for 3 min initial denaturation, 30 cycles of 95°C for 20 sec, 58°C for 30 sec annealing (for GN1a and GS3) and 72°C for1 min extension and final extension cycle of 72°C for 5 min.
One percent agarose gel stained with 5 μL ethidium-bromide in a horizontal electrophoresis tank system containing 1x TAE buffer. About 6 μL of 100 bp ladder were used at both edges. The electrophoresis run was programmed as follows: 35 min, current/100 milliamps (mA) and voltage/120 V. The gels were visualized and their snap shots were taken in a gel documentation system (Desktop gel imager, scope 21).
| Table 2: | Genes, primers and expected band size of rice genotypes | |||
| Gene | Forward primer (5-3) | Length | GC (%) | Tm | Reverse primer (5-3) | Length | GC (%) | Tm | Expected amplicon size (bp) |
| GN1a | GCCTTCCATCGTCAGCAC | 18 | 61.1 | 51.5 | GCAGTTGAGCATGAGGAG | 18 | 57.9 | 505 | 185 |
| GS3 | CAAGTGCGTGCTGCCTCA | 18 | 61.1 | 53.9 | AGCGGCACGAGCATCAGC | 18 | 64.7 | 52.5 | 390 |
Data analysis: The data collected for grain yield attribute (plant height, number of tillers, panicle length, panicle number, number of grain per panicle, panicle weight panicle type and grain dimensions) was subjected to One-way Analysis of Variance (ANOVA) using Statistical Analysis System (SAS Version 9.4) at 95% level of significance. The results were expressed as Mean+Standard Deviation (SD) of three replicates and the differences between the means were separated using Duncan’s New Multiple Range Test (DNMRT).
RESULTS
The results on the evaluation of yield and identification of yield responsive genes (GN1a and GS3) in selected rice genotypes were presented.
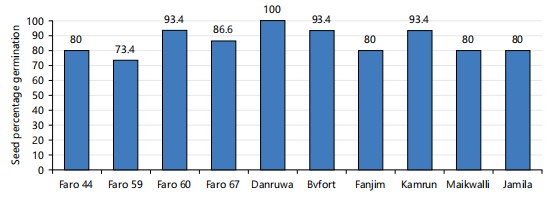
Seed percentage germination: The results on rice seed percentage germination of both land races and released genotypes were taking fourteen days after sowing. The seed germination percentage of the selected rice genotype varied from 73.4 to 100%. The genotype DanRuwa has the highest germination percentage of 100%, while the “FARO59” genotype had the lowest percentage of 73.4%. The genotypes, FARO44, Fanjim, Maikwalli, Jamila, FARO67, FARO60, Bvfort and Kamrun had 80, 80, 80, 86.6, 93.4, 93.4 and 93.4%, respectively. However, the results differ significantly (p<0.05) as shown in Fig. 1.
Morpho-agronomic traits: Significant differences (p<0.05) exist amongst genotypes for plant height at maturity with Maikwalli (92.47 cm) recorded the tallest plants while Danruwa (73.87 cm) had the shortest plant height. Number of tiller counted were significantly different (p<0.05) among the genotypes such that FARO60 (37.00) produced the highest number of tillers compared to Maikwalli (18.33) which produced the lowest tillers among all the entries. Panicle length observed in this study was significantly different in all the entries with FARO67 (25.92 cm) recorded the highest compared to genotype Bvfort (20.37 cm) which had the lowest as shown in Table 3.
| Table 3: | Mean values for plant height (ph) number of tillers (NT) and panicle length (PL) | |||
| Genotypes | PH (cm) | NT | PL (cm) |
| FARO44 | 78.57±7.24bc | 32.00±1.41ab | 22.28±1.30ab |
| FARO59 | 77.83±1.63c | 28.00±0.71bc | 21.17±0.18ab |
| FARO60 | 84.43±7.13abc | 37.00±1.41a | 26.38±2.11a |
| FARO67 | 81.10±10.95bc | 24.33±1.47cd | 25.92±2.76a |
| Dan ruwa | 73.87±15.77d | 23.67±1.08cde | 21.64±0.39ab |
| Bvfort | 86.20±3.96abc | 24.00±1.41cd | 20.37±0.39b |
| Fanjim | 84.83±2.22abc | 20.67±2.19de | 20.50±0.31b |
| Kamrun | 82.47±20.24abc | 20.33±1.08de | 22.10±0.64ab |
| Maikwalli | 92.47±8.51a | 18.33±1.08e | 20.56±0.32b |
| Jamila | 90.10±2.72ab | 21.00±1.41de | 20.43±0.47b |
| Values are Mean±SD of biological triplicate, means with the same letters within column are not significantly different (p<0.05) | |||
|
| Table 4: | Mean Values for panicle numbers (PN) number of grain per panicle (NGPP) and panicle weight (PW) | |||
| Genotypes | PN (cm) | NGPP | PW (cm) |
| FARO44 | 22.67±2.19abc | 172.69±19.86a | 2.40±0.10b |
| FARO59 | 20.00±0.17bcde | 150.67±18.58a | 1.47±0.05c |
| FARO60 | 26.00±2.83ab | 151.33±17.01a | 2.40±0.21b |
| FARO67 | 17.67±1.78cde | 163.67±8.62a | 2.60±0.26ab |
| Danruwa | 20.33±1.08bcd | 141.33±9.50a | 2.83±0.21ab |
| Bvfort | 17.00±1.41cde | 166.33±6.66a | 3.03±0.15a |
| Fanjim | 14.33±1.08de | 159.33±22.90a | 2.70±0.10ab |
| Kamrun | 28.33±1.08a | 175.00±10.54a | 2.83±0.11ab |
| Maikwalli | 16.00±0.71de | 160.33±19.66a | 2.97±0.12a |
| Jamila | 14.00±0.71e | 157.00±13.00a | 2.67±0.25ab |
| Values are Mean±SD of biological triplicate, means with the same letters within column are not significantly different (p<0.05) | |||
| Table 5: | Mean values for days to fifty percent flowering (DF) and grain yield (GY) | |||
| Genotypes | DF | GY |
| FARO44 | 104.00±6.00cde | 1204.80±73.20bc |
| FARO59 | 91.00±4.73de | 637.20±41.30d |
| FARO60 | 103.00±5.57cde | 1689.10±335.10a |
| FARO67 | 107.00±9.64bcd | 1259.06±233.10b |
| Dan ruwa | 85.00±4.36e | 1204.10±64.30bc |
| Bvfort | 114.00±5.29abc | 1049.40±121.40bcd |
| Fanjim | 126.00±5.29ab | 795.20±112.20cd |
| Kamrun | 93.00±6.43de | 1771.70±83.30bcd |
| Maikwalli | 131.00±5.51a | 975.10±60.70a |
| Jamila | 130.00±12.72a | 759.70±39.20d |
| Values are Mean±SD of biological triplicate, means with the same letters within column are not significantly different (p<0.05) | ||
There was significant difference in the genotypes for panicle number such that Kamrun (28.33) had the highest panicle number among the entries studied; Whereas Jamila (14.00) recorded the least panicle number. Grain number per panicle observed among the entries was not statistically different with Kamrun (175.00) recorded the highest number compared to Danruwa (141.33) which recorded the lowest among all the genotypes. Panicle weight was statistically different among all the genotypes such that Bvfort (3.03g) recorded the highest weight compared to FARO59 (1.47g) which recorded the lowest among all the genotypes as shown in Table 4.
Days to 50% flowering were significantly (p<0.05) different for all the entries such that Fanjim (126), Jamila (130) and Maikwalli (131) recorded the longest days to flowering compared to Danruwa (85) which was the shortest duration to 50% flowering amongst the entries. The individual performance in terms of grain yield of some rice genotypes are not significantly different (p<0.05) for all the entries such that Kamrun (1771.70) recorded the highest yield compared to FARO59 (637.20) which recorded the lowest yield per plant as shown in Table 5.
Panicle exertion were significantly (p<0.05) different among the genotypes with the following FARO59, FARO67, Danruwa, Fanjim and Jamila recorded the highest score (9) compared to FARO44, FARO60, Bvfort, Kamrun and Maikwalli which recorded the lowest score (3) as shown in Table 6. Panicle base were significantly (p<0.05) different among the genotypes with the following FARO59, FARO67, Danruwa, Fanjim and Jamila are well exerted at panicle base while FARO44, FARO60, Bvfort, Kamrun and Maikwalli are partly exerted at panicle base and both of the varieties possess 2 cleft at the ligules as shown in Table 6.
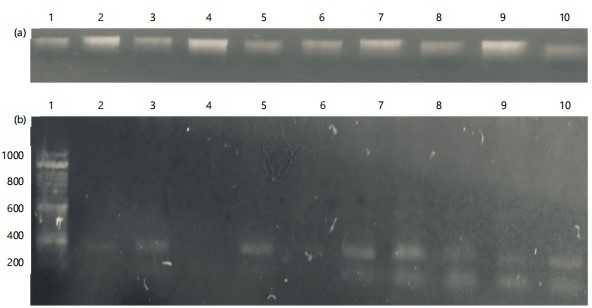
Gene amplification: The amplification of selected yield responsive genes (GN1a and GS3) using multiplex Polymerase Chain Reaction (PCR) revealed that FARO59, FARO67, Bvfort, Fanjim, Kamrun, Maikwalli and Jamila showed double and clear bands using band size of 185 bp and 390 bp and FARO44 show only one band which is GN1a as shown in Fig. 2a-b.
|
| Table 6: | Panicle exertion of ligule, panicle base and scale | |||
| Genotypes | Ligule | Panicle base | Scale |
| FARO44 | 2 cleft | Partly exerted | 3 |
| FARO59 | 2 cleft | Well exerted | 9 |
| FARO60 | 2 cleft | Partly exerted | 3 |
| FARO67 | 2 cleft | Well exerted | 9 |
| Dan ruwa | 2 cleft | Well exerted | 9 |
| Bvfort | 2 cleft | Partly exerted | 3 |
| Fanjim | 2 cleft | Well exerted | 9 |
| Kamrun | 2 cleft | Partly exerted | 3 |
| Maikwalli | 2 cleft | Partly exerted | 3 |
| Jamila | 2 cleft | Well exerted | 9 |
DISCUSSION
The evaluation of yield indices and identification of yield responsive genes (GN1a and GS3) of selected rice genotypes revealed that the analysis of variance for plant height that was found to be significant (p<0.05) among the various genotypes studied is in conformity with those of Kole and Hasib27. The significant differences (p<0.05) among the genotypes for tiller number in this finding was supported by that of Mamunur Rahman et al.28. This result corroborated with the findings of Saif-Ur-Rasheed et al.29 and Girish et al.30 who reported the positive association of yield per with plant height at genotypic level. This implies that increase in plant height may increase grain yield31.
Significant differences (p<0.05) among the genotypes for days to 50% flowering in this study is similar to those previously reported by Xue et al.32, who observed variation in days to flowering of several genotypes and identified a regulatory gene responsible for variation in physiological trait among rice genotypes. Variation among genotypes for this quantitative trait might be due to the genetic makeup of the genotype or interaction with the environment. The availability of early flowering and maturing genotypes are important for the avoidance of drought condition.
In the present study, the extraction method was based on standard DNA extraction Kit (Plant/Seed Miniprep kit: Fig. 2a and b). The band size of 185 and 390 bp multiplex PCR products for GN1a and GS3 genes, respectively on the gels shows double and clear bands for all the rice genotypes screened except lane 3 and 5 (FARO60 and Danruwa). This is supported by the observed band sizes of 185 and 390 bp for Gn1a and GS3 PCR positive results for the genotype while FARO60 showed no bands may belong to the interspecific rice (NERICA) and as such may have different gene alleles. The PCR assay did work because only two total nucleic acid- template lanes showed no band. In the present study, lane 1 (FARO44) showed a single band and 1 single weak band. The weak bands may be due to small copy numbers of the targeted DNA region within the extracted genomic. Lorenz33 pointed out that it is not the concentration of the extracted total nucleic acid that counts but rather the number of copies of the region targeted. He posited that copies of 104 to 107 of the targeted total nucleic acid region are required for PCR with a total reaction volume of 50 μL. The two other sample genotypes (FARO60 and Danruwa) show no bands at all. This indicates that the two genotypes have no Gn1a and GS3 gene or have a different variant of the gene resulting in primer mismatch with the complementary sequences.
Furthermore, primer sets used to screen for Gn1a and GS3 (not shown) require further optimization because none of the genotypes screened was amplified. These indicate that both the primer sets may have regions of preference on the genomic total nucleic acid different from the targeted sequence on the positive control genotype. The PCR failures could be a result of polymorphisms such as SNP, indels and copy number variations. Unexpected SNP in a designed primer, in particular in the 3" end (SNP-in primer), primers designed within the intron/exon boundaries, or repetitive DNA elements are possible reasons for PCR failures34.
The study is attributed to identify all those genes that are responsible for determination of grain yield of selected rice genotypes and it is limited only to grain number and grain size of rice genotypes. Quantitative RT-PCR should be carried out to know the level of expression of the genes in those genotypes found to be positive for the genes screened for their yield improvement.
CONCLUSION AND RECOMMENDATIONS
In this study, all the ten genotypes evaluated showed better grain characteristics and germination. The FARO60, Maikwalli, Bvfort and Kamrun accessions proved to be the best in terms of grain characteristics while Danruwa, FARO44, FARO60 and Kamrun proved to have the best better yield and as such its adoption could increase rice production and thus help restore Nation’s hope of food security in the near future. The positive correlation that existed between grain yield and plant height, grain yield and panicle weight, grain yield and days to 50% flowering should be used as basis for improvement of the rice varieties cultivated in the lowland environment.
Based on the results of the study, it is recommended that; Danruwa, FARO44 and Maikwali which out yielded the first appearance could be subjected to further trial to ascertain their level of performance. Research should be conducted to ascertain the presence or otherwise of other yield responsive genes such as GS2, GS5, GS6, IPA1, DST and GLW7 using other molecular markers, for yield component assessment. The yield responsive genes found to be positive should be cloned and sequenced to determine the level of gene variation among the rice genotypes and quantitative RT-PCR should be carried out to know the level of expression of the genes in those cultivars found to be positive of the genes screened and those found to be robustly expressed be transferred to other genotypes for their yield improvement.
SIGNIFICANCE STATEMENT
The populations in the major rice-consuming countries continue to grow at a rate of more than 1.5% per year. To meet this challenge, rice varieties with higher yield potential and greater yield stability are needed. However, local rice production lags behind consumption and this is mainly due to the low yield levels attained on smallholder farms. Improving the quantity and quality of rice grain has been approached to solve several problems among the world population such as decreasing the number of hidden hunger and malnutrition. However, a wide variation of grain morphological characteristics will be required as a source of genetic materials in breeding for some specific traits as it would affect consumer acceptance in the end.
REFERENCES
- Lopez, S.J., 2008. TaqMan based real time PCR method for quantitative detection of basmati rice adulteration with non-basmati rice. Eur. Food Res. Technol., 227: 619-622.
- Zhao, M., Y. Lin and H. Chen, 2020. Improving nutritional quality of rice for human health. Theor. Appl. Genet., 133: 1397-1413.
- Cassman, K.G., A. Dobermann, D.T. Walters and H. Yang, 2003. Meeting cereal demand while protecting natural resources and improving environmental quality. Ann. Rev. Environ. Resour., 28: 315-358.
- Ashfaq, M., A.S. Khan, S.H.U. Khan and R. Ahmad, 2012. Association of various morphological traits with yield and genetic divergence in rice (Oryza sativa). Int. J. Agric. Biol., 14: 55-62.
- Ashikari, M., H. Sakakibara, S. Lin, T. Yamamoto and T. Takashi et al., 2005. Cytokinin oxidase regulates rice grain production. Science, 309: 741-745.
- Fan, C., Y. Xing, H. Mao, T. Lu and B. Han et al., 2006. GS3, a major QTL for grain length and weight and minor QTL for grain width and thickness in rice, encodes a putative transmembrane protein. Theor. Appl. Genet., 112: 1164-1171.
- Song, X.J., W. Huang, M. Shi, M.Z. Zhu and H.X. Lin, 2007. A QTL for rice grain width and weight encodes a previously unknown RING-type E3 ubiquitin ligase. Nat. Genet., 39: 623-630.
- Wang, E., J. Wang, X. Zhu, W. Hao and L. Wang et al., 2008. Control of rice grain-filling and yield by a gene with a potential signature of domestication. Nat. Genet., 40: 1370-1374.
- Huang, X., Q. Qian, Z. Liu, H. Sun and S. He et al., 2009. Natural variation at the DEP1 locus enhances grain yield in rice. Nat. Genet., 41: 494-497.
- Wang, J., T. Nakazaki, S. Chen, W. Chen and H. Saito et al., 2009. Identification and characterization of the erect-pose panicle gene EP conferring high grain yield in rice (Oryza sativa L.). Theor. Appl. Genet., 119: 85-91.
- Zhou, Y., J.Y. Zhu, Z.Y. Li, C.D. Yi and J. Liu et al., 2009. Deletion in a quantitative trait gene qPE9-1 associated with panicle erectness improves plant architecture during rice domestication. Genetics, 183: 315-324.
- Miura, K., M. Ikeda, A. Mastubara, X.J. Song and M. Ito et al., 2010. OsSPL14 promotes panicle branching and higher grain productivity in rice. Nat. Genet., 42: 545-549.
- Li, Y., C. Fan, Y. Xing, Y. Jiang and L. Luo et al., 2011. Natural variation in GS5 plays an important role in regulating grain size and yield in rice. Nat. Genet., 43: 1266-1269.
- Sun, L., X. Li, Y. Fu, Z. Zhu and L. Tan et al., 2013. GS6, A member of the GRAS gene family, negatively regulates grain size in rice. J. Integr. Plant Biol., 55: 938-949.
- Hu, J., Y. Wang, Y. Fang, L. Zeng and J. Xu et al., 2015. A rare allele of GS2 enhances grain size and grain yield in rice. Mol. Plant, 8: 1455-1465.
- Li, S., B. Zhao, D. Yuan, M. Duan and Q. Qian et al., 2013. Rice zinc finger protein DST enhances grain production through controlling Gn1a/OsCKX2 expression. Proc. Natl. Acad. Sci. U.S.A., 110: 3167-3172.
- Si, L., J. Chen, X. Huang, H. Gong and J. Luo et al., 2016. OsSPL13 controls grain size in cultivated rice. Nat. Genet., 48: 447-456.
- Karim, K.Y., B. Ifie, D. Dzidzienyo, E.Y. Danquah and E.T. Blay et al., 2020. Genetic characterization of cassava (Manihot esculenta Crantz) genotypes using agro-morphological and single nucleotide polymorphism markers. Physiol. Mol. Biol. Plants, 26: 317-330.
- Burchi, F., J. Fanzo and E. Frison, 2011. The role of food and nutrition system approaches in tackling hidden hunger. Int. J. Environ. Res. Public Health, 8: 358-373.
- Malek, M.A., M.Y. Rafii, M.S.S. Afroz, U.K. Nath and M.M.A. Mondal, 2014. Morphological characterization and assessment of genetic variability, character association, and divergence in soybean mutants. Sci. World J., 2014.
- Pandey, P., V. Irulappan, M.V. Bagavathiannan and M. Senthil-Kumar, 2017. Impact of combined abiotic and biotic stresses on plant growth and avenues for crop improvement by exploiting physio-morphological traits. Front. Plant Sci., 8.
- Hien, N.L., W.A. Sarhadi, Y. Oikawa and Y. Hirata, 2007. Genetic diversity of morphological responses and the relationships among Asia aromatic rice (Oryza sativa L.) cultivars. Tropics, 16: 343-355.
- Xing, Y. and Q. Zhang, 2010. Genetic and molecular bases of rice yield. Annu. Rev. Plant Biol., 61: 421-442.
- Zhou, Y., Y. Tao, Y. Yuan, Y. Zhang and J. Miao et al., 2018. Characterisation of a novel quantitative trait locus, GN4-1, for grain number and yield in rice (Oryza sativa L.). Theor. Appl. Genet., 131: 637-648.
- NPC, 2007. Report of Nigeria's national population commission on the 2006 census. Popul. Dev. Rev., 33: 206-210.
- Ishimaru, K., M. Kosone, H. Sasaki and T. Kashiwagi, 2004. Leaf contents differ depending on the position in a rice leaf sheath during sink–source transition. Plant Physiol. Biochem., 42: 855-860.
- Kole, P.C. and K.M. Hasib, 2008. Correlation and regression analysis in scented rice. Madras Agric. J., 95: 178-182.
- Mamunur Rahman, M., A. Hussain, M.A. Syed, A. Ansari and M.A.A. Mahmud, 2011. Comparison among clustering in multivariate analysis of rice using morphological traits, physiological traits and simple sequence repeat markers. Am. Eurasian J. Agric. Environ. Sci., 11: 876-882.
- Saif-Ur-Rasheed, M., H.A. Sadaqat and M. Babar, 2002. Correlation and path co-efficient analysis for yield and its components in rice (Oryza sativa L.). Asian J. Plant Sci., 1: 241-244.
- Girish, T.N., T.M. Gireesha, M.G. Vaishali, B.G. Hanamareddy and S. Hittalmani, 2006. Response of a new IR50/Moroberekan recombinant inbred population of rice (Oryza sativa L.) from an indica × japonica cross for growth and yield traits under aerobic conditions. Euphytica, 152: 149-161.
- Hallauer, A.R. and J.B. Miranda, 1988. Quantitative Genetics in Maize Breeding. 2nd Edn., Iowa State University Press, Ames, Iowa, ISBN: 9780813815220, Pages: 468.
- Xue, W.Y., Y. Xing, X. Weng, Y. Zhao and W. Tang et al., 2008. Natural variation in Ghd7 is an important regulator of heading date and yield potential in rice. Nat. Genet., 40: 761-767.
- Lorenz, T.C., 2012. Polymerase chain reaction: Basic protocol plus troubleshooting and optimization strategies. J. Vis. Exp., 63.
- Piriyapongsa, J., C. Ngamphiw, A. Assawamakin, P. Wangkumhang and P. Suwannasri et al., 2009. RExPrimer: An integrated primer designing tool increases PCR effectiveness by avoiding 3' SNP-in-primer and mis-priming from structural variation. BMC Genomics, 10.
How to Cite this paper?
APA-7 Style
Yahaya,
B., Gumi,
A.M., Yahaya,
M.A., Aliero,
A.A., Onu,
A., Shehu,
A. (2024). Evaluation of Yield Indices and Identification of Yield Responsive Genes (GN1a and GS3) of Selected Rice Genotypes
. Asian Journal of Biological Sciences, 17(4), 548-557. https://doi.org/10.3923/ajbs.2024.548.557
ACS Style
Yahaya,
B.; Gumi,
A.M.; Yahaya,
M.A.; Aliero,
A.A.; Onu,
A.; Shehu,
A. Evaluation of Yield Indices and Identification of Yield Responsive Genes (GN1a and GS3) of Selected Rice Genotypes
. Asian J. Biol. Sci 2024, 17, 548-557. https://doi.org/10.3923/ajbs.2024.548.557
AMA Style
Yahaya
B, Gumi
AM, Yahaya
MA, Aliero
AA, Onu
A, Shehu
A. Evaluation of Yield Indices and Identification of Yield Responsive Genes (GN1a and GS3) of Selected Rice Genotypes
. Asian Journal of Biological Sciences. 2024; 17(4): 548-557. https://doi.org/10.3923/ajbs.2024.548.557
Chicago/Turabian Style
Yahaya, Bara’u, Abubakar Muhammad Gumi, Muhammad Abdullah Yahaya, Abubakar Adamu Aliero, Andrew Onu, and Abdulkadir Shehu.
2024. "Evaluation of Yield Indices and Identification of Yield Responsive Genes (GN1a and GS3) of Selected Rice Genotypes
" Asian Journal of Biological Sciences 17, no. 4: 548-557. https://doi.org/10.3923/ajbs.2024.548.557

This work is licensed under a Creative Commons Attribution 4.0 International License.