Soil Loss Estimation and Sub-Watersheds Prioritization for Management Using GIS-Based RUSLE Technique in Halaba-Bilate Watershed, Ethiopia
-
Zemede Amado


Department of Natural Resource Management Research, Southern Agricultural Research Institute, Hawassa, Ethiopia
Tewodros AssefaDepartment of Water Resources and Irrigation Engineering, Institute of Technology, Hawassa University, Hawassa, Ethiopia
| Received 20 Sep, 2023 |
Accepted 15 Dec, 2023 |
Published 31 Mar, 2024 |
Background and Objective: Soil erosion is a global problem that causes land degradation. Soil loss risk had posed a serious threat to farmer’s livelihood of Halaba Bilate Watershed. This study was carried out with the main objective of examining soil loss risk and assessing soil loss vulnerability by the RUSLE model using GIS for soil conservation in Halaba Bilate Watershed. Materials and Methods: Data on rainfall, soil, digital elevation model and satellite imageries were acquired and processed to develop RUSLE factors. The rainfall erosivity, soil erodibility, slope length and steepness, vegetation covers and conservation practice factors were used as input for model. The factors were processed and combined on Arc GIS 10.8. The annual soil loss rate was estimated using RUSLE. The watershed was divided into five subclasses based on the drainage of the area. Hotspot areas were identified and prioritized based on the mean annual soil loss value of each sub-watershed. Results: Annually about 1,536,907.46 tons of soil were lost from 13120.17 ha with an average rate of 16.5 t/ha/year. About 20.67% of watershed was categorized under severe to very severe with respect to the annual soil loss. The sub watersheds (3, 4, 2, 1 and 5) ranked 1st to 5th, respectively based on mean annual soil loss rate for planning intervention. The 3rd Sub watershed (Swsh3) had highest average annual soil loss value poor vegetation cover, poor management, degraded lands and inappropriate farming practices in steep slope areas of watershed. Conclusion: It can be concluded that the watershed is exposed to soil loss. The entire parts of watershed especially the fields covered by cultivated land, grasslands and bare lands require intervention. Therefore, Swsh3 should attain the first priority level during SWC planning and intervention based on the availability of budget, labor, time, skill and capacity of project.
| Copyright © 2024 Amado and Assefa. This is an open-access article distributed under the Creative Commons Attribution License, which permits unrestricted use, distribution, and reproduction in any medium, provided the original work is properly cited. |
INTRODUCTION
Soil is the basic resource for the development of the economy, sustainable production of landscapes and improvement of livelihoods, especially in an agrarian economy. However, soil degradation is a seriouschallenge to human sustenance as it remains a global environmental threat in natural ecosystems, agriculture and agro-ecosystems where smallholders rely1.
Land degradation due to erosion processes incurs substantial costs both for individual farmers and society as a whole2. Soil erosion was responsible for approximately 85% of global land attenuation3. Similarly, soil degradation caused by water erosion risk was shown to harm one-third of agricultural soils4. Soil erosion induced by water is the most devastating form of soil deterioration and it is most severe in the tropics and subtropics compared to the rest of the world. Due to significant population pressure, land scarcity and a critical lack of conservation resources by smallholder farmers in Africa and Asia, the risk of soil erosion is serious4.
Water-induced soil erosion has been a difficult and ongoing problem in Ethiopia for decades5. The country’s average annual soil loss is estimated to be 18 ton/ha/year6, with severity increasing in the highlands7. Ethiopia’s highlands cover 43% of the country’s total land area8. This high potential area has been extensively populated9 and soil erosion is exacerbated by intensive farming methods, steep slopes and high rainfall erosivity10. Rain-fed agricultural areas in Ethiopia’s highlands lose 940,893,165 t of net soil per year2, affecting two-thirds of the country’s population11. Soil erosion rates in the Ethiopian highlands range from 16-300 ton/ha/year in farmed fields12 to 130-170 ton/ha/year under similar land use in Ethiopia’s northwestern highlands13. However, the acceptable level of soil loss that can be maintained while maintaining an economically productive level14 ranges from 5 to 11 ton/ha/year15. Soil erosion in Ethiopia reduced land potential productivity by 10% in 2010 and will reduce it by 30% by 2030, according to modeling studies. As a result, agricultural value-added per capita per year decreased from $372 in 2010 to $162 in 203016. Thus, reversing soil erosion is a top priority in order to attain food security, poverty reduction and environmental sustainability in the country7,17.
Inadequate land management techniques, land-use changes and road development in sensitive areas were among the most significant causes of land degradation and desertification18. As a result, it is critical to quantify soil loss, geographical patterns and the degree of soil erosion risk within watersheds. Estimates can provide a complete understanding of the processes and variables influencing soil erosion, as well as prospective soil losses from the entire watershed and specific sub-parts. The spatial patterns of erosion risk are far too complicated. Furthermore, traditional land mapping methods based on field surveys do not give spatially explicit information. The spatial extent and severity of erosion risk are required for soil conservation planning and watershed management strategies. Erosion models were utilized as prediction tools for estimating soil loss and erosion risk for conservation planning in order to meet these situations19. There are numerous soil erosion models, the most well-known of which is the Universal Soil Loss Equation (USLE), which is used as an empirical soil loss model all over the world20. Later in the 1980s, the USDA-Agricultural Research Service revised the model to the Revised Universal Soil Loss Equation (RUSLE), which was a better version of the USLE that incorporated new methodologies and corrected the USLE’s weaknesses. The RUSLE used the same concept as the USLE but with significant changes in the determining elements and a larger application to other scenarios, such as forest lands, rangelands and disturbed areas20. It is a method of computation that can be used for site evaluation, planning and assisting in the decision-making process when selecting erosion control measures. It estimates soil loss and produces numerical findings that can be used to validate the advantages of planned erosion control measures in high-risk regions21.
When integrated with modern GIS and RS techniques, the prediction capacity of the empirical model RUSLE at multiple temporal and spatial scales has enhanced. According to Haregeweyn et al.16, as referenced by Lu et al.22, a combination of RS, GIS and RUSLE has the ability to quantify soil erosion loss and make its geographic distribution viable at affordable costs and with improved accuracy in broader areas.
The Halaba Bilate Watershed is characterized by intensive farming, limited SWC practice, complete removal of crop residues, deforestation, overgrazing and inappropriate tillage practices that boost soil loss23. Mainly farmers of the watershed use crop residues for livestock feed after crop harvesting. This exposes the soil to wind and water erosion. Moreover, there was no habit of integrating perennial cash crops into the farming system to offset the erosion hazard. As a result, soil loss risk has continued to cause a serious threat to each farmer in the area and the economic development of the country. Farmers were not aware of soil loss from their farmland until large gullies were formed24. Hence, researchers must quantify the loss and make the recommended solution. The classification of the watershed into sub-parts for potential risk of extensive soil erosion and prioritization of sub-watersheds for soil conservation interventions plan were performed. Achieving information on spatial variations in soil loss is necessary when planning soil conservation efforts25. The information about the risk of soil erosion and its impacts is necessary to plan and implement conservation measures that help to minimize the risk. So, this study was conducted by considering the above-listed problems in Halaba Bilate Watershed, Rift Valley basin of Ethiopia. The objective of the study was to estimate the mean annual soil loss rate and prioritize sub-parts using the GIS-based RUSLE model of the Halaba Bilate Watershed.
MATERIALS AND METHODS
Description of the study area
Geographical location: The study was conducted in Halaba-Bilate Watershed located in the Halaba Zone of Southern Nations, Nationalities and People’s Regional State, Ethiopia from October 2021 to September 2022. It is also located in the Great Rift Valley, about 85 km from Hawassa town and 310 km from Addis Ababa (the capital city of Ethiopia). It is a hydrological subset of Bilate River sub-basin that covers 13120.17 ha. The watershed is geographically located at 38'1'0" to 38°11'0"East and 7°18'0" to 7°28'0"m North.
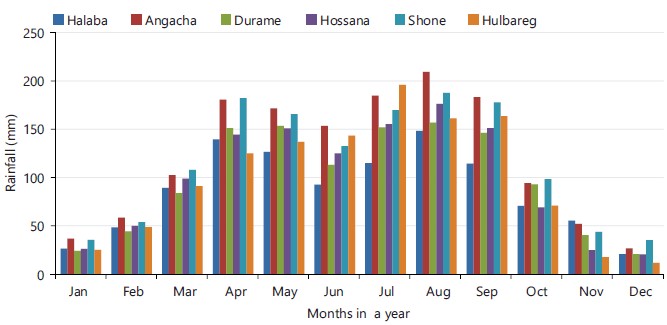
Agro-ecology and climatic condition of the watershed: Halaba Bilate Watershed is characterized by moist midland agro ecology. The moist midland was classified as upper, middle and lower depending on the topography and elevation. According to the meteorological data obtained from the National Meteorological Agency of Ethiopia; the mean annual precipitation of the watershed ranged from 1035.29 to 1124.61 mm per year as shown in (Fig. 1) and the average annual minimum and maximum temperature values were 13.25°C and 28.10°C, respectively. The watershed receives bimodal rainfall, where the minimum rain was received between March and April while the maximum rain was received from July to September. The main agricultural production seasons in the watershed are Belg in the Amharic language (February-May) which is the small rainy season, Kiremt (June-September) which is the main rainy season and the dry season, Bega (October-January) that has no rain.
Soil: Based on the soil data obtained from MoA, Halaba Bilate Watershed consists of four dominant soil types; namely Vertic Andosols, Luvic Phaeozems, Chromic Luvisols and Umbric Nitosols. About 45.66% of the total landmass of the watershed was covered by Vertic Andosols. The Luvic Phaeozems, Chromic Luvisols and Umbric Nitosols cover area account for 11.72, 14.83 and 27.79%, respectively. Luvisols have moderate resilience to degradation and moderate to low sensitivity to yield decline26.
Topography: The altitude of the watershed ranges from 1713 to 2118 m.a.s.l, but most subparts are found in 1800-2000 m above sea level. Higher altitudinal ranges are located at the northeast, northwest and southwest parts of the watershed as shown in Fig. 2a. The slope of the study watershed ranges from flat (0-0.2) to very steep (>60%) as shown in Fig. 2b. (Source: USGS).
Land use and vegetation cover: Mainly the watershed was covered by; cultivated land, shrublands, woodlands, settlement, bare lands and grassland/grazing lands. The crops including maize, teff, haricot bean, millet and sorghum were dominant annual crops grown in the watershed. Farmland cover is expanding from year to year through minimizing grazing and woodlands and also the marginal lands between the farmlands were becoming very narrow. Some Scattered trees like Acacia albida sp. were grown on major parts of the watershed whereas Eucalyptus camaldulensis sp. was grown around the homestead. The vegetation which consists of evergreen and semi-evergreen bushes, small trees and occasionally larger trees was populated very sparsely. Source: (Field data and Halaba Agriculture Zone and NRD).
|
Softwares and materials with their applications:
| • | ArcGIS 10.8: Database creation, dataset preparation, raster calculation, displaying and viewing spatial data and map layout preparation | |
| • | ERDAS 2014: Land sat 8 image pre-processing, LULC classification, post classification change detection and map layout preparation | |
| • | GPS (Garmin 72): Used to mark watershed outlet point, soil and LULC sample sites | |
| • | Digital camera: Used to capture of land use, land cover, soil erosion risk sites and partial view of the watershed | |
| • | Auger: Used to collect soil samples with 20 cm depth |
Spatial data generation: The following 5 parameters are used in the RUSLE model to estimate the mean annual soil loss of the watershed as shown in Fig. 3. These are rainfall erosivity, soil erodibility, slope length, steepness factor, cover management factor and conservation practice factors. The average annual soil loss expected in the field was estimated using Equation (1) developed by Belayneh et al.27.
A = R×K×LS×C×P |
(1) |
where, A is the average annual soil loss (ton/ha/year); R is the rainfall erosivity factor (MJmm ton/ha/year); K is the soil erodibility factor (t/ha/MJ mm); LS is the slope length and steepness factor; C is the land surface cover management factor and P is conservation practices factor.
Rainfall erosivity (R) factor generation: Rainfall erosivity or R-factor is one of the six factors of RUSLE. In RUSLE estimation of rainfall erosivity factor was based on the multiplication of total storm energy by 30 min rainfall intensity of the area; expressed as R = EI3028. However, it was difficult to apply this equation directly in Ethiopian conditions. This was due to a lack of long-term data on rainfall amounts and intensities. Instead, there is an equation that was modified in the real situations of Ethiopia by Hurni and ECFSCDD6 to be applied using easily available average annual or seasonal precipitation data collected from various meteorological observatories near the watershed and interpolated for rainfall erosivity factor estimation Fig. 4a.

|
For the “R” value estimation of this study, a time series of 35 years (1985 to 2020) monthly rainfall data of six stations were located near to study area and their geographical references were collected from the national metrological agency of Ethiopia (NMA). These stations were; Halaba, Angacha, Durame, Hossana, Shone and Hulbareg stations. Of those stations, Halaba station is located within the watershed, but the other five were found near Halaba Bilate Watershed. The mean annual rainfall of the six stations was used for erosivity factor estimation as shown in Table 1. Interpolation of rainfall data was made in ArcMap10.8 using spatial analysis tool by IDW interpolation. After having the interpolated rainfall data, R-factors within the study area were assigned based on the equation. In this study, Hurni’s empirical Equation 6 which estimates the R-value for the Ethiopian condition was used as indicated in Equation 2.

|
| Table 1: | Mean annual precipitation and erosivity factor value of each stations | |||
Station |
Latitude (decimal degrees) |
Longitude (decimal degrees) |
Altitude (m.a.s.l) |
Mean annual RF (mm) |
Erosivity of station (MJmm/ha/h/year) |
Halaba |
38.093917 |
7.310583 |
1772 |
1035.28 |
571.64 |
Angacha |
37.8572 |
7.3405 |
2317 |
1309.62 |
725.27 |
Durame |
37.8915 |
7.24 |
2116 |
1074.95 |
593.85 |
Hossana |
37.85383 |
7.5673 |
2307 |
1147.68 |
634.58 |
Shone |
37.952667 |
7.1335 |
1959 |
1298.02 |
718.77 |
Hulbareg |
38.120333 |
7.736333 |
1992 |
1086.67 |
600.42 |
R = -8.12+0.56 P |
(2) |
Where, R is rainfall erosivity parameter and P is the mean annual rainfall in mm.
The estimated rainfall erosivity value of the Halaba Bilate Watershed ranged from 571.64 (low) to 621.66 (high) MJ mm/ha/h/yr. The IDW interpolation result showed that the western and northwestern parts of the watershed received relatively higher rainfall and had high erosive power of rainfall. But, the southern part of the watershed received the less erosive rainfall as shown in Fig. 4b.
Soil erodibility (K) factor generation: The soil erodibility factor (K) value implies the influence of soil properties on soil loss during storm events in highland areas29. It is also defined as the rate of soil loss per unit of R-factor on a unit plot, with a range of 0 to 128. The cohesive force between soil particles determines it, which varies based on the presence or lack of plant cover, soil moisture content and the development of its structure29. The erodibility of a soil is determined by its texture, organic matter, structure and permeability30. To calculate and analyze the soil erodibility (K value) 96 samples composed of 48 composites were collected randomly from different parts of the watershed and analyzed at the Hawassa Agricultural Research Center soil laboratory. The soil samples were analyzed to determine soil texture, organic matter content and permeability of soil in the laboratory. The soil textural class analysis for sand, silt and clay (%) of the soil was performed using the hydrometer method and soil organic carbon content was determined by using Walkley and Black31 method. Soil permeability was obtained from the relation between soil textural classes and permeability rate developed by Wischmeier and Smith29.

|

|
But, soil structure was identified in the field by using soil visual descriptors methods suggested by Shepherd32. To determine the major soil type of watershed, a digital soil map of Rift Valley Lakes Basin was collected from the ministry of agriculture (MoA) as shown in Fig. 5a. Soil samples were collected randomly during the dry season and the sampling points were recorded using Garmin 72 GPS device. All the soil laboratory analyses, field observation results and extracted soil digital map data were used for K value calculation. Different methods of soil erodibility estimations were suggested, but this study used the equation developed by Foster et al.33 given in Equation 3 as:
| (3) |
where, K is soil erodibility factor, M is particle size parameter; (percent silt+percent very fine sand) (100% clay), a is percent organic matter, b is soil structure code used in soil classification; (very fine granular is 1, fine granular is 2, medium or coarse granular is 3, blocky, platy or massive is 4) and c is soil permeability class; (rapid is 1, moderate to rapid is 2, moderate is 3, slow to moderate is 4, slow is 5, very slow is 6). Therefore, using the Equation 3 soil erodibility factor (K-value) for each soil sample was calculated and the soil erodibility map was generated as raster data through interpolation by the ‘Kriging’ method.
Soil erodibility values in the study watershed ranged from 0.19 to 0.49. The highest soil erodibility values were observed in the eastern and northern parts of the study area. This implied that the soils of those areas were highly vulnerable to erosion because they had low stability and infiltration rates, which might lead to high runoff and soil loss. The soils in the southwestern parts of the study area had relatively low erodibility values as shown in Fig. 5b.
Slope length and slope steepness (LS) factor generation: The RUSLE computes the LS factor as a ratio of soil loss from the soil of interest to that from a standard RUSLE plot of 22.1 m in length with a 9% slope4. Its influence is even higher than the remaining parameters on soil loss34. To Halaba Bilate Watershed DEM was extracted based on the study watershed shape file. The combined value of the LS factor was then calculated using a raster calculator in ArcGIS 10.8 based on flow accumulation, size (30.71×30.71 m) of DEM and slope steepness of the study watershed by using Equation 4 that was developed by Ayele et al.5.
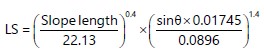 |
(4) |
Where, slope length is flow accumulation* cell resolution (DEM) and θ is the slope in degree. The slope length map is shown in Fig. 6b.
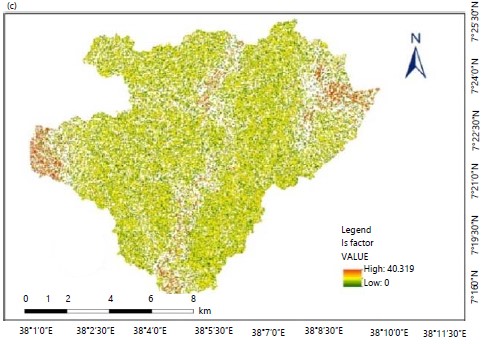
Mainly higher slope steepness classes were observed in the western and northeastern parts of the watershed as shown in Fig. 6a. In other words, 0.37% of the area had flat terrain which is 0-0.2 and 0.62% of the area had very steep terrain which was >60%. The estimated LS factor in the watershed ranged from 0 to 40.32 as shown in Fig. 6c.
Vegetation covers (C) factor generation: The vegetation cover management factor (C) represents how the cover of the land, cropland uses and crop management systems determine soil loss instead of losses from bare fallow areas9.
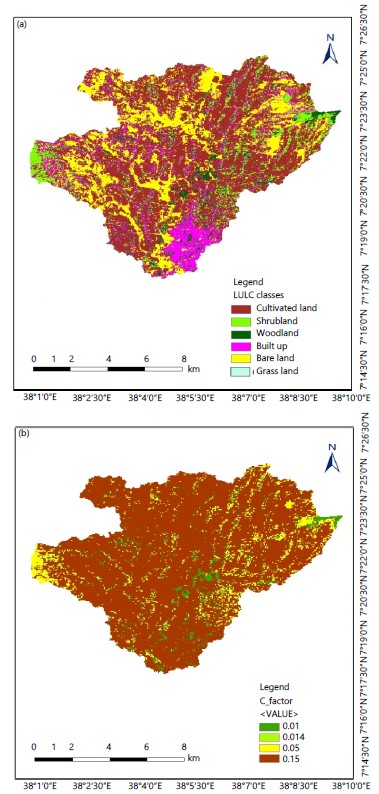
LULC of the watershed was categorized into six major land use classes; cultivated land, shrub land, woodland, built-up, bare land and grasslands as shown in Fig. 7a. These LULC classes were used as an input for generating the C-factor of each year. The C-values suggested by different authors based on land use were used as shown in Table 2.
After LULC classes were made C-values for each class were assigned. The cover management factor value of the study area ranged from 0.01 in woodland to 0.15 in cultivated lands as shown in Fig. 7b.
|
|
| Table 2: | Area of LULC and published C-values | |||
| LULC type | Area (ha) |
Area cover (%) |
C-value |
References |
| Cultivated land | 6555.45 |
49.96 |
0.15 |
Hurni and ECFSCD6, Bewket and Teferi17 and Amsalu and Mengaw35 |
| Shrub land | 1233.13 |
9.4 |
0.014 |
Hurni and ECFSCD6, Gessesse et al.1 and Moges and Bhat36 |
| Wood land | 667.68 |
5.08 |
0.01 |
Hurni and ECFSCD6 and Zerihun et al.37 |
| Bare land | 2988.6 |
22.78 |
0.05 |
Moges and Bhat36 and Haile and Fetene38 |
| Built up | 1675.22 |
12.77 |
0.05 |
Moges and Bhat36 |
| Grass land | 0.09 |
0 |
0.05 |
Hurni and ECFSCD6 and Haile and Fetene38 |
| Total | 13120.17 |
100 |
Conservation practice (P) factor generation: The range of the P factor varies from 0 to 1. The lower the value corresponds to the presence of more effective conservation practice and the highest values correspond to a bare without any support practices8. As the data obtained from the Halaba Bilate Watershed revealed, only a few SWC bunds were implemented in steep slope areas, but it was difficult to estimate the p-value from it due to the absence of sufficient data. Indeed, terraces were constructed by mass-community mobilization, but most of them were in poor design, poor excavation and partially disturbed due to lack of maintenance. So, by considering the unavailability of data in the watershed on permanent management factors and an absence of soil conservation practices in many sub-parts, p-values were developed using a combination of slope and LULC for estimation of thep-value as proposed by Wischmeier and Smith29 as shown in (Table 3). The method was also used by other similar studies9,39. The land use land cover and p-value maps of the study area were presented on Fig. 8(a-b), respectively.

|

|
| Table 3: | Land use type and its area within slope class’s and p-factor values suggested by Zeleke13 | |||
| Land use type | Slope class (%) |
p-value |
| Agricultural land use | 0-5 |
0.1 |
05-Oct |
0.12 |
|
Oct-20 |
0.14 |
|
20-30 |
0.19 |
|
30-50 |
0.25 |
|
50-100 |
0.33 |
|
| Other land uses | 1 |
|
RESULTS AND DISCUSSION
Soil loss rate in the watershed as determined by RUSLE: Based on the soil loss analysis, the total amount of soil loss in Halaba Bilate Watershed was estimated as 1,536,907.46 tons per year (Fig. 9). While potential annual soil loss risk (Min and Max) of the study area ranged from 0 to 298.742 ton/ha/year across the watershed. Similarly, the average soil loss was estimated as 16.5 ton/ha/year. The estimated soil loss rate and the spatial patterns were generally realistic compared to what can be observed in the field and similar research results. It was in agreement with the findings of Atoma et al.40, who found an estimated annual soil loss value ranging from 0-400 t/ha/yr for Huluka Watershed located in Central Ethiopia and Belayneh et al.27, who found the annual soil loss value of 0-442.92 ton/ha/year for Gumara Watershed in the upper part of Blue Nile Basin. The research conducted by Girmay et al.39 elaborated on the annual soil loss ranging from 0-897 ton/ha/year in Agewmariam Watershed located in Northern Ethiopia. Moreover, Haregeweyn et al.9 reported the soil loss value ranged from 0 to 200 ton/ha/year in Upper Blue Nile Basin. The finding was also in line with Hurni12, who found soil loss values ranged from 16-300 ton/ha/year in the Ethiopian highlands. Additionally, the results were in agreement with the latest reports of Tamene and Vlek et al.5, who found soil loss of 0 in flat terrain to 279 ton/ha/year in the steep slope in the Omo-Gibe River Basin located in Southern Ethiopia.
Relatively lower soil loss results were reported than our result by Gashaw et al.41 that reported 0-23.7 ton/ha/year for Geleda Watershed and Wolka et al.42 found that the estimated soil loss value that was 2.52-85.64 ton/ha/year for Chelelaka area located in the Central Rift Valley of Ethiopia. The findings of this study were also realistic to earlier studies by Hurni and ECFSCDD6, who reported the average annual soil loss was 18 ton/ha/year for Ethiopia. He also showed an estimated average of 20 metric ton/ha/year in the highlands of Ethiopia and Eritrea where soil losses were extremely high6 and measured amounts of more than 300 metric ton/ha/year on specific plots. Therefore, this study has demonstrated that the estimation of soil loss rate using RUSLE modeling is in good agreement with findings obtained by other studies.
|
| Table 4: | Mean annual soil loss amount and severity classes in the Halaba Bilate Watershed | |||
| Annual soil loss (ton/ha/year) | Severity classes |
Priority class |
Area (%) |
Annual soil loss (ton/year) |
Total soil loss (%) |
| 0-5 | Very slight |
V |
28.02 |
55,905.36 |
3.64 |
| May-15 | Slight |
IV |
29.86 |
251,160.68 |
16.34 |
| 15-30 | Moderate |
III |
21.47 |
426,649.56 |
27.76 |
| 30-50 | Severe |
II |
17.71 |
608,918.92 |
39.62 |
| >50 | Very severe |
I |
2.95 |
194,272.93 |
12.64 |
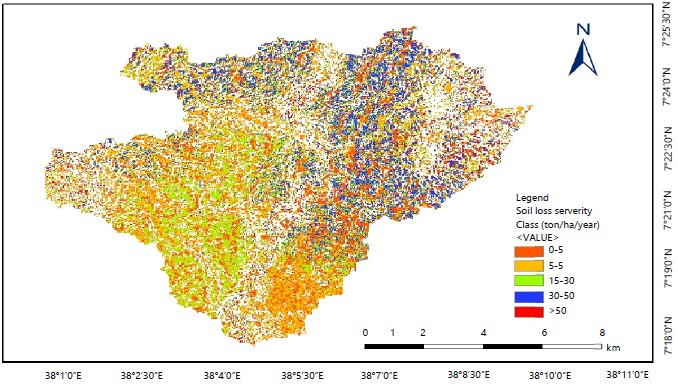
The soil loss severity in the watershed were categorized as very slight (0- 5), slight (5-15) ton/ha/year, moderate (15-30), severe (30-50), very severe (>50) ton/ha/year) as shown in Fig. 10. There was a variation in soil loss amount, severity level and extents between sub-parts of the watershed. The result showed that about 28.02% of the areas had an estimated soil loss value of <5 ton/ha/year that was categorized as very slightly eroded. These areas mainly had flat to gentle slopes. Table 4 depicts that 29.86% of the land had slight erosion risk (5-15 ton/ha/year), 21.47% of the land had moderate erosion risk (15-30 ton/ha/year), 17.71% of the land were categorized as severe erosion risk (30-50 ton/ha/year) and 2.95% of the area had very severe (>50 ton/ha/year) soil loss values. The potential soil loss results showed that northeastern and northwestern parts of Halaba Bilate Watershed fall within severe to very severe classes of soil erosion. Some parts in the western crest of Watershed also had severe to very severe erosion risk as shown in (Fig. 10). Those extensively high erosion rates in the above part of the watershed were mainly attributed to the topography and land cover (Table 5-6).
This is because the topography of those parts was strongly sloping to very steep terrain, had very sparse vegetation cover, cultivation on steep slope areas and had dominant bare land cover and other RUSLE parameters characteristics of the more erosion-prone areas of the watershed.
|
Spatial variation of annual soil loss along slope and LULC in the watershed: According to Biesemans et al.43, the vegetation cover factor together with slope steepness and length factors are most sensitive to soil loss. The estimated result of this study confirmed the existence of greater soil erosion rate spatial variability in the watershed. This is mainly attributed to the characteristics of the area in terms of slope and land use land cover of the watershed.
Spatial variation of annual soil loss along with the slope classes: Study finding shows there was a recognized variation in soil erosion rate with the slope in the Halaba Bilate Watershed. 53.65% of the area in the watershed was situated on a slope <10% and 46.37% of the watershed cover was situated on a slope ≥10%. The result of this study indicated that the highest and lowest soil loss value in the watershed was obtained from (2-5%) and (0.2-0.5%), respectively as shown in (Table 5). This happened due to the maximum (42.5%) of the area was categorized under the 2-5% slope class. But, the very minimum areas were encompassed under the slope of 0.2-0.5% resulting in a low annual soil loss value. In other way, areas with a higher than ≥10% slope gradient had a high estimated average soil loss value compared with areas that have medium and lower slope gradients.
The estimated soil loss in a very steep slope class (>60%) ranged from 12.9 to 106.3 ton/ha/year. The average soil loss in this slope class was 57.83 ton/ha/year, which was the highest average soil loss rate compared to other slope classes. This indicated that steep slope areas of the watershed were more prone to soil erosion caused by water. The reason for this was the increased cultivation in steep slope areas of the watershed that caused easy removal of topsoil. But, the lower average annual soil loss values were obtained from level and flat slope classes. The area coverage and variation of soil erosion rate from different slope classes is shown in (Table 5).
Spatial variation of annual soil loss with LULC classes: Based on the analysis, there was a significant variation in soil loss between LULC classes of Halaba Bilate Watershed. The higher soil loss value was 69.48 and 13.54% of the total was obtained from cultivated land and bare lands, respectively. This happened due to the expansion of cultivated lands by cutting trees and shrubs and changing grasslands to the farmlands. Similarly, the highest mean annual soil loss value was observed in cultivated land, but the lower value was observed in grassland. The results obtained by zonal statistics analysis of RUSLE output and LULC on Arc map 10.8 were shown in (Table 6).
| Table 5: | Variation of soil erosion rates with slope classes | |||
Area
|
Estimated annual soil loss |
||||||
| FAO slope class (%) | Ha |
(%) |
Soil loss (ton/year) |
(%) |
Min (ton/ha/year) |
Max (ton/ha/year) |
Mean |
| Flat (0-0.2) | 49.12 |
0.37 |
347.16 |
0.02 |
0 |
45.5 |
0.66 |
| Level (0.2-0.5) | 0.28 |
0 |
2.45 |
0 |
0.48 |
1.33 |
0.08 |
| Nearly level (0.5-1) | 330.56 |
2.52 |
15831.77 |
1.03 |
0 |
49.44 |
4.39 |
| Very gently sloping (1-2) | 1084.13 |
8.26 |
159357.65 |
10.35 |
0 |
53.1 |
13.55 |
| Gently sloping (2-5) | 5577.81 |
42.5 |
1075103.2 |
69.81 |
0 |
71.18 |
19.2 |
| Sloping (5-10) | 4638.09 |
35.4 |
75271.9 |
4.89 |
0 |
141.38 |
7 |
| Strongly sloping (10-15) | 875.12 |
6.67 |
154090.53 |
10 |
0.02 |
245.44 |
27.73 |
| Moderately steep (15-30) | 357.03 |
2.72 |
43930.49 |
2.85 |
0.01 |
255.16 |
26.61 |
| Steep (30-60) | 126.29 |
0.96 |
15623.58 |
1.01 |
0.17 |
298.74 |
48.82 |
| Very steep (>60) | 81.74 |
0.62 |
578.3 |
0.04 |
12.92 |
106.3 |
57.83 |
| Total | 13120.17 |
100 |
1,540137.04 |
100 |
|||
| Table 6: | Variation of annual soil erosion rates with LULU classes | |||
Area |
Estimated annual soil loss |
||||||
| LULC class | Ha |
(%) |
Soil loss (ton/year) |
(%) |
Min (ton/ha/year) |
Max (ton/ha/year) |
Mean |
| Cultivated land | 6555.45 |
49.96 |
107,0272.47 |
69.48 |
0 |
283.8 |
22.97 |
| Shrub land | 1233.13 |
9.4 |
96622.79 |
6.27 |
0 |
298.74 |
11.58 |
| Wood land | 667.68 |
5.09 |
32096.08 |
2.08 |
0 |
129.63 |
6.58 |
| Bare land | 2988.6 |
22.78 |
208526.22 |
13.54 |
0 |
171.83 |
11.53 |
| Built up | 1675.22 |
12.77 |
132868.66 |
8.63 |
0 |
266.08 |
10.79 |
| Grass land | 0.09 |
0 |
101 |
0.007 |
0 |
90.3 |
4.5 |
| Total | 13120.17 |
100 |
1,540386.24 |
100 |
0 |
||
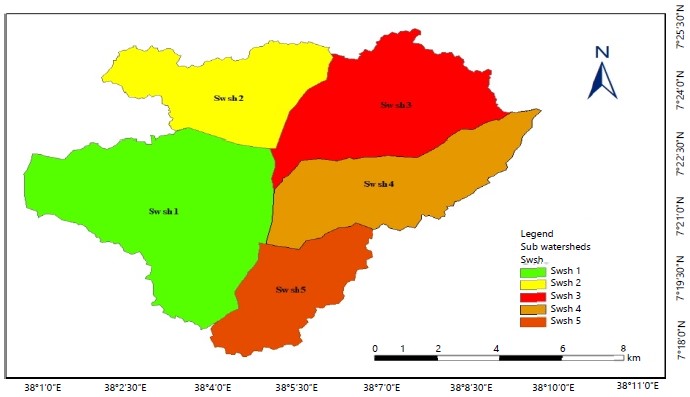
Identification of critical areas and prioritizing parts of a watershed for intervention: All parts of the watershed could not be eroded to the same extent because of their differences in environmental attributes across landscapes25. Thus, identification and prioritization of sub-watersheds based on their soil erosion susceptibility are very important to soil and water conservation intervention. Identification of more risky sub-watersheds is basic for the selection of prior-focus areas for conservation planning41. In this study, five sub-watersheds were created to identify and prioritize based on the drainage system of the study watershed as shown in Fig. 11.
The mean annual soil loss values of each sub watershed were extracted from the main Halaba Bilate Watershed raster data. Those values of each sub-watershed revealed that nearly the entire watershed requires the implementation of different types of conservation measures. Thus, critical sub-watersheds identification and prioritizing were performed based on the mean annual soil loss value of each sub-watershed.
As indicated in Table 7, the average soil loss value of sub-watersheds ranged from10.43 to 21 ton/ha/year. The critical sub-watersheds were prioritized for reducing soil loss through management. The result indicated that from the created sub-watershed; the sub-watershed “Swsh3” needs urgent conservation followed by “Swsh4", “Swsh2”, “Swsh1” and “Swsh5” sub-watersheds, respectively. According to the output as shown in Table 7; the sub-watershed prioritized as the 1st (Swsh3) had a total soil loss of 384, 826.99 ton/year with an average of 21.36 ton/ha/year from its area of 2761.56 ha. The sub-watershed (Swsh4) which was ranked the 2nd had a total loss of 340,197.07 ton/year with an average loss of 20.85 ton/ha/year from 2422.49 ha.
| Table 7: | Average annual soil loss of sub-watershed of the study area | |||
| Sub-watershed | Area(ha) |
Area (%) |
Total annual soil loss (ton/year) |
Mean soil loss loss (ton/ha/year) |
Range of soil loss (ton/ha/year) |
Priority classes |
| Swsh1 | 4286.8 |
32.67 |
396,581.73 |
13.23 |
0-298.74 |
IV |
| Swsh2 | 2044.88 |
15.59 |
252,749.61 |
18.67 |
0-153.19 |
III |
| Swsh3 | 2761.56 |
21.05 |
384,826.99 |
21.36 |
0-141.38 |
I |
| Swsh4 | 2422.49 |
18.46 |
340,197.07 |
20.85 |
0-245.44 |
II |
| Swsh5 | 1604.44 |
12.22 |
128,989.89 |
10.43 |
0-141.53 |
V |
The subwatershed (Swsh2) which was ranked as the 3rd had a total soil loss of 252,749.61 ton/year with an average loss of 18.67 ton/ha/year from 2044.88 ha. The subwatershed (Swsh1) which got the 4th rank had a total soil loss of 396,581.73 ton/year with an average of 13.23 ton/ha/year from its total area (4286.8 ha). Finally, the last ranked sub-watershed (Swh5) covers the lowest area which was 1604.44 ha and had a total soil loss of 128,989.89 ton/year with an average of 10.43 ton/ha/year. The sub-watersheds that ranked the 1st require immediate intervention for implementing best-suited soil and water conservation measures followed by the 2nd, 3rd, 4th and 5th sub-watersheds, respectively. During field observation, the researchers observed that sub-watersheds prioritized at the 1st and 2nd levels consisted of dominant bare lands, poor land cover and degraded lands that caused maximum soil loss. These areas also had very steep slopes including mountains that increased runoff velocity. So, the result we obtained truly shows the soil erosion impact of the watershed was realistic with the ground truth.
The soil loss tolerance value reflects the maximum allowable soil loss that sustained an economic and a high level of productivity29. The normal SLT values range from 5 to 11 t/ha/yr. Tamene and Vlek15 accordingly, the 87.77% area of the Halaba Bilate Watershed had a soil loss value greater than the tolerable value (11 ton/ha/year). However, only 12.22% of the total area had a mean soil loss value of 10.43 ton/ha/year, which was within the soil loss tolerable level.
According to Haregeweyn et al.9 watersheds that had a dominant cultivated land cover, human and livestock population density had a strong relationship with soil erosion risk. Indeed, the study watershed had dominant bare lands that were degraded and no vegetation cover. To reduce the impact of runoff, those areas of the watershed need immediate better soil and water conservation measures implemented based on the priority of the sub-parts to rehabilitate affected areas and sustain the land resource.
The sub-watersheds that had the soil loss values greater than the maximum soil loss tolerance level need soil and water conservation intervention. So, immediate management intervention should be undertaken by considering priority levels based on the availability of budget, labor, time, skill and capacity of the project.
Even though Sub-watershed (Swsh 5) had the soil loss value within the tolerant soil loss level, biological and agronomic SWC measures implementation and maintenance of physical structures should be undertaken to improve sustainability.
CONCLUSION
This study provides the soil loss estimation in Halaba Bilate Watershed based on the combined application of RUSLE and GIS technology. Based on the study results the following conclusions were drawn; Firstly, according to the RUSLE estimation result currently Halaba Bilate Watershed lost 1,536,907.46 ton of soil annually with the range of 0 to 298.74 ton/ha/year and the average loss was 16.5 ton/ha/year. About 20.67% of the watershed was categorized under severe to very severe concerning the annual soil loss and 51.33% of the area was in the slight to moderate severity category. The study also identified and prioritized sub-watersheds based on the mean annual soil loss rate (susceptibility for soil erosion). Swsh3 and Swsh4 had high average annual soil loss values. The reasons for this were poor vegetation cover, poor management, degraded lands and inappropriate farming practices in steep slope areas of the watershed. But, only Swsh5 was found under the SLT level. This happened due to better farming and management practices in some parts of the sub-watershed. Thus, Swsh3, Swsh4, Swsh2, Swsh1 and Swsh5 were prioritized as 1st, 2nd, 3rd, 4th and 5th, respectively for soil conservation measures plan and implementation. There were sites within sub-watersheds that had soil loss value >50 ton/ha/year, needing urgent attention. The governmental and non-governmental organizations engaged in watershed management works at the Halaba-Bilate watershed should apply the information derived from this study during the planning of management activities. This study is limited to agro ecology, landscape and soil characteristics of the study area. To develop sustainable watershed management, the researcher also recommends that further studies be undertaken that focus on the assessment of socio-economic factors, population impact, farming system, land use pattern, biophysical factors and others that cause soil erosion.
SIGNIFICANCE STATEMENT
The findings of this study showed Halaba-Bilate watershed was exposed to soil loss. The study identified and prioritized sub-watersheds based on the mean annual soil loss rate (susceptibility for soil erosion). Out of five sub-watersheds, four had a soil loss value greater than the tolerable value. The reasons for this were poor vegetation cover, poor management, degraded lands and inappropriate farming practices in steep slope areas of the watershed. The study will help researchers to conduct further studies on the assessment of soil erosion initiating factors, especially socio-economic, farming system, land use pattern and biophysical factors in the study area.
ACKNOWLEDGMENTS
Our special thanks go to Southern Agricultural Research Institute for facilitating our study and, providing soil laboratory service and other required facilities. The authors would like to acknowledge the Ethiopian Ministry of Agriculture and National Meteorology Agency for providing digital soil data and climate data, respectively. USGS is also gratefully acknowledged for the permission of free download of satellite imageries and SRTM DEM of the study area. Finally, we highly acknowledge Halaba Zone and Wera district Agriculture and Natural Resource Development offices for providing the required secondary data of the study area.
REFERENCES
- Gessesse, B., W. Bewket and A. Bräuning, 2015. Model-based characterization and monitoring of runoff and soil erosion in response to land use/land cover changes in the Modjo Watershed, Ethiopia. Land Degrad. Dev., 26: 711-724.
- Hurni, K., G. Zeleke, M. Kassie, B. Tegegne and T. Kassawmar et al., 2015. Soil Degradation and Sustainable Land Management in the Rainfed Agricultural Areas of Ethiopia: An Assessment of the Economic Implications. The Economic of Land Degradation, Bonn, Germany, ISBN: 978-92-808-6056-6, Pages: 94.
- Singh, G. and R.K. Panda, 2017. Grid-cell based assessment of soil erosion potential for identification of critical erosion prone areas using USLE, GIS and remote sensing: A case study in the Kapgari watershed, India. Int. Soil Water Conserv. Res., 5: 202-211.
- Blanco-Canqui, H. and R. Lal, 2008. Principles of Soil Conservation and Management. Springer, New York, USA, ISBN-13: 9781402087097, Pages: 617.
- Ayele, N.A., H.R. Naqvi and D. Alemayehu, 2022. Rainfall induced soil erosion assessment, prioritization and conservation treatment using RUSLE and SYI models in highland watershed of Ethiopia. Geocarto Int., 37: 2524-2540.
- Hurni, H. and ECFSCDD, 1985. Soil Conservation Manual for Ethiopia: A Field Guide for Conservation Implementation. Verlag nicht ermittelbar, Addis Abeba.
- Shiferaw, A., 2012. Estimating soil loss rates for soil conservation planning in Borena Woreda of South Wollo highlands of Ethiopia: The case from the legemara watershed. Ethiopian J. Bus. Econ., 2: 1-34.
- Desalegn, A., A.T. Gessesse and F. Tesfay, 2018. Developing GIS-based soil erosion map using RUSLE of andit tid watershed, central highlands of Ethiopia. J. Sci. Res. Rep., 19.
- Haregeweyn, N., A. Tsunekawa, J. Poesen, M. Tsubo and D.T. Meshesha et al., 2017. Comprehensive assessment of soil erosion risk for better land use planning in river basins: Case study of the Upper Blue Nile River. Sci. Total Environ., 574: 95-108.
- Fazzini, M., C. Bisci and P. Billi, 2015. The Climate of Ethiopia. In: Landscapes and Landforms of Ethiopia, Billi, P. (Ed.), Springer, Dordrecht, Netherlands, ISBN: 978-94-017-8025-4, pp: 65-87.
- Hurni, H., B. Debele and G. Zeleke, 2015. Saving Ethiopia’s Soils. In: Eastern and Southern Africa Partnership Programme: Highlights from 15 Years of Joint Action for Sustainable Development, Ehrensperger, A., C. Ott and U. Wiesmann (Eds.), Centre for Development and Environment (CDE); Bern Open Publishing (BOP), Bern, Switzerland, ISBN: 978-3-906813-03-5, pp: 27-30.
- Hurni, H., 1988. Degradation and conservation of the resources in the Ethiopian highlands. Mt. Res. Dev., 8: 123-130.
- Zeleke, G., 2000. Landscape Dynamics and Soil Erosion Process Modelling in the North-Western Ethiopian Highlands. University of Berne, Institute of Geography, Bern, Switzerland, ISBN: 9783906151472, Pages: 201.
- Brhane, G. and K. Mekonen, 2009. Estimating soil loss Using Universal Soil Loss Equation (USLE) for soil conservation planning at Medego Watershed, Northern Ethiopia. J. Am. Sci., 5: 58-69.
- Tamene, L. and P.L.G. Vlek, 2008. Soil Erosion Studies in Northern Ethiopia. In: Land Use and Soil Resources, Braimoh, A.K. and P.L.G. Vlek (Eds.), Springer, Dordrecht, Netherlands, ISBN: 978-1-4020-6777-8, pp: 73-100.
- Haregeweyn, N., A. Tsunekawa, J. Nyssen, J. Poesen and M. Tsubo et al., 2015. Soil erosion and conservation in Ethiopia: A review. Prog. Phys. Geogr.: Earth Environ., 39: 750-774.
- Bewket, W. and E. Teferi, 2009. Assessment of soil erosion hazard and prioritization for treatment at the watershed level: Case study in the Chemoga watershed, Blue Nile basin, Ethiopia. Land Degrad. Dev., 20: 609-622.
- Keenan, R.J., G.A. Reams, F. Achard, J.V. de Freitas, A. Grainger and E. Lindquist, 2015. Dynamics of global forest area: Results from the FAO Global Forest Resources Assessment 2015. For. Ecol. Manage., 352: 9-20.
- Popp, J.H., D.E. Hyatt and D. Hoag, 2000. Modeling environmental condition with indices: A case study of sustainability and soil resources. Ecol. Modell., 130: 131-143.
- Kouli, M., P. Soupios and F. Vallianatos, 2009. Soil erosion prediction using the Revised Universal Soil Loss Equation (RUSLE) in a GIS framework, Chania, Northwestern Crete, Greece. Environ. Geol., 57: 483-497.
- Karydas, C.G., T. Sekuloska and G.N. Silleos, 2009. Quantification and site-specification of the support practice factor when mapping soil erosion risk associated with olive plantations in the Mediterranean island of Crete. Environ. Monit. Assess., 149: 19-28.
- Lu, D., G. Li, G.S. Valladares and M. Batistella, 2004. Mapping soil erosion risk in Rondônia, Brazilian Amazonia: Using RUSLE, remote sensing and GIS. Land Degrad. Dev., 15: 499-512.
- Cerretelli, S., L. Poggio, A. Gimona, G. Yakob and S. Boke et al., 2018. Spatial assessment of land degradation through key ecosystem services: The role of globally available data. Sci. Total Environ., 628: 539-555.
- Desta, G. and H. Hurni, 2011. Farmers' Participatory Soil Erosion Assessment and Soil Conservation Improvement: Application Of Local Erosion Indicators. ESAPP, Bern, Switzerland, Pages: 37.
- Tamene L., S.J. Park, R. Dikau and P.L.G. Vlek, 2006. Reservoir siltation in the semi-arid highlands of northern Ethiopia: Sediment yield-catchment area relationship and a semi-quantitative approach for predicting sediment yield. Earth Surf. Processes Landforms, 31: 1364-1383.
- Kelley, H.W., 1983. Keeping the Land Alive: Soil Erosion-Its Causes and Cures. Food and Agriculture Organization, Rome, Italy, ISBN: 9789251013427, Pages: 79.
- Belayneh, M., T. Yirgu and D. Tsegaye, 2019. Potential soil erosion estimation and area prioritization for better conservation planning in Gumara watershed using RUSLE and GIS techniques. Environ. Syst. Res.
- Renard, K.G., 1997. Predicting Soil Erosion by Water: A Guide to Conservation Planning with the Revised Universal Soil Loss Equation (RUSLE). U.S. Department of Agriculture, Agricultural Research Service, Washington, DC, USA, ISBN-13: 9780160489389, Pages: 384.
- Wischmeier, W.H. and D.D. Smith, 1978. Predicting Rainfall Erosion Losses: A Guide to Conservation Planning. Department of Agriculture, Science and Education Administration, Washington, DC, USA, Pages: 58.
- Efe, R., D. Ekinci and I. Curebal, 2008. Erosion analysis of sahin creek watershed (NW of Turkey) using GIS based on rusle (3d) method. J. Appl. Sci., 8: 49-58.
- Walkley, A. and I.A. Black, 1934. An examination of the degtjareff method for determining soil organic matter, and a proposed modification of the chromic acid titration method. Soil Sci., 37: 29-38.
- Shepherd, T.G., 2000. Visual Soil Assessment Field Guide for Cropping and Pastoral Grazing on Flat to Rolling Country. Horizons MW/Landcare Research, Manawatū-Whanganui, New Zealand, ISBN: 1-877221-92-9, Pages: 84.
- Foster, G.R., D.K. McCool, K.G. Renard and W.C. Moldenhauer, 1981. Conversion of the universal soil loss equation to SI metric units. J. Soil Water Conserv., 36: 355-359.
- Hoffmann, A., M.A. da Silva, M.L.N. Silva, N. Curi, G. Klinke and D.A.F. de Freitas, 2013. Development of Topographic Factor Modeling for Application in Soil Erosion Models. In: Soil Processes and Current Trends in Quality Assessment, Soriano, M.C.H. (Ed.), IntechOpen, London, United Kingdom, ISBN: 978-953-51-1029-3 pp: 111-138.
- Amsalu, T. and A. Mengaw, 2014. GIS based soil loss estimation using RUSLE model: The case of Jabi Tehinan Woreda, ANRS, Ethiopia. Nat. Resour., 5: 616-626.
- Moges, D.M. and H.G. Bhat, 2017. Integration of geospatial technologies with RUSLE for analysis of land use/cover change impact on soil erosion: Case study in rib watershed, North-Western highland Ethiopia. Environ. Earth Sci., 76.
- Zerihun, M., M.S. Mohammedyasin, D. Sewnet, A.A. Adem and M. Lakew, 2018. Assessment of soil erosion using RUSLE, GIS and remote sensing in NW Ethiopia. Geoderma Reg., 12: 83-90.
- Haile, G.W. and M. Fetene, 2012. Assessment of soil erosion hazard in Kilie catchment, East Shoa, Ethiopia. Land Degrad. Dev., 23: 293-306.
- Girmay, G., A. Moges and A. Muluneh, 2020. Estimation of soil loss rate using the USLE model for agewmariayam watershed, northern Ethiopia. Agric. Food Secur., 9.
- Atoma, H., K.V. Suryabhagavan and M. Balakrishnan, 2020. Soil erosion assessment using RUSLE model and GIS in Huluka watershed, Central Ethiopia. Sustain. Water Resour. Manag., 6.
- Gashaw, T., T. Tulu and M. Argaw, 2017. Erosion risk assessment for prioritization of conservation measures in Geleda watershed, Blue Nile Basin, Ethiopia. Environ. Syst. Res., 6.
- Wolka, K., H. Tadesse, E. Garedew and F. Yimer, 2015. Soil erosion risk assessment in the Chaleleka wetland watershed, Central Rift Valley of Ethiopia. Environ. Syst. Res., 4.
- Biesemans, J., M. van Meirvenne and D. Gabriels, 2005. Extending the RUSLE with the Monte Carlo error propagation technique to predict long-term average off-site sediment accumulation. J. Soil Water Conserv., 55: 32-42.
How to Cite this paper?
APA-7 Style
Amado,
Z., Assefa,
T. (2024). Soil Loss Estimation and Sub-Watersheds Prioritization for Management Using GIS-Based RUSLE Technique in Halaba-Bilate Watershed, Ethiopia. Asian Journal of Biological Sciences, 17(1), 1-20. https://doi.org/10.3923/ajbs.2024.1.20
ACS Style
Amado,
Z.; Assefa,
T. Soil Loss Estimation and Sub-Watersheds Prioritization for Management Using GIS-Based RUSLE Technique in Halaba-Bilate Watershed, Ethiopia. Asian J. Biol. Sci 2024, 17, 1-20. https://doi.org/10.3923/ajbs.2024.1.20
AMA Style
Amado
Z, Assefa
T. Soil Loss Estimation and Sub-Watersheds Prioritization for Management Using GIS-Based RUSLE Technique in Halaba-Bilate Watershed, Ethiopia. Asian Journal of Biological Sciences. 2024; 17(1): 1-20. https://doi.org/10.3923/ajbs.2024.1.20
Chicago/Turabian Style
Amado, Zemede, and Tewodros Assefa.
2024. "Soil Loss Estimation and Sub-Watersheds Prioritization for Management Using GIS-Based RUSLE Technique in Halaba-Bilate Watershed, Ethiopia" Asian Journal of Biological Sciences 17, no. 1: 1-20. https://doi.org/10.3923/ajbs.2024.1.20

This work is licensed under a Creative Commons Attribution 4.0 International License.