Characterization of Agromorphological Diversity in Synthetic Bread Wheat (Triticum aestivum L.) Genotypes Targeted for Higher Yield Potential
-
Syeda Sidra Naz
Department of Botany, Hazara University Mansehra, Khyber Paktunkhwa 21120, Pakistan
Shah FaisalDepartment of Botany, Hazara University Mansehra, Khyber Paktunkhwa 21120, Pakistan
Faizul Haq
Department of Botany, Government Degree College, Battagram, Khyber Pakhtunkhwa 21040, Pakistan
Naiz AliDepartment of Botany, Hazara University Mansehra, Khyber Paktunkhwa 21120, Pakistan
Abdur RahimDepartment of Botany, Hazara University Mansehra, Khyber Paktunkhwa 21120, Pakistan
Sani BegumDepartment of Botany, Hazara University Mansehra, Khyber Paktunkhwa 21120, Pakistan
| Received 15 Dec, 2023 |
Accepted 19 Feb, 2024 |
Published 31 Mar, 2024 |
Background and Objective: Triticum aestivum (hexaploid genome i.e., AABBDD) belongs to family Poaceae-having five subspecies. The important species of are Triticum monococcum (einkorn), Triticum dicoccon (emmer) and Triticum spelta (spelt). The main objective of the study was to identify and evaluate different genotypes of wheat for potential yield. Materials and Methods: The current study evaluated 39 wheat genotypes of diverse origins with 20 agromorphological parameters based on ANOVA and LSD analysis, descriptive analysis and correlation test. The germplasm was planted in Randomized Complete Block Design (RCBD) with three replications and spacing between the rows was kept at 75 cm and the width was 12 cm. Results: Maximum grains per spike were observed in accession number 11 and recorded at 91.00 grains per spike while minimum grains per spike was observed in accession number 22 and recorded as 20.00 grains per spike. The greatest value of thousand-grain weight was observed in accession numbers 17 and 24 which were recorded as 50 g while the smallest value was observed in accession number 38 which was recorded as 30.24 g. The greatest harvest index was observed in accession number 11 which was 69.0084 while lowest value was observed in accession number 7 which was 30.4491. Conclusion: Combining the results of all parameters accession no 11, 17 and 24, are superior lines and may be used for increasing the yield potential of future synthetic wheat lines. Current study results may facilitate future wheat improvement programs as well as the development of agronomically desirable wheat cultivars.
| Copyright © 2024 Naz et al. This is an open-access article distributed under the Creative Commons Attribution License, which permits unrestricted use, distribution, and reproduction in any medium, provided the original work is properly cited. |
INTRODUCTION
Human population is increasing day by day and is expected to reach 9.4 billion by 2050 and it will reduce the world’s agricultural land by 10-20%, due to urbanization, environmental pollution and utilization of agricultural lands for other purposes1. If the climatic changes continue and melt the Himalayan glaciers, changes in the monsoon or flooding patterns or drought regimes in Asia will result in the loss of world cereal production by up to 25%. Therefore, to meet the growing demand of global food shortage from the present cropland food production must increase by 50% at least to meet our demands of 20502.
Wheat is an economical and rich source of energy and proteins and supplies one-fifth of all human calories for the world population3. Plant breeders are constantly trying to discover wheat germplasm having desirable traits to resist diseases and other environmental stresses1,4.
About 35% of the world population in more than 40 countries use wheat as a staple food. As compared to other cereal crops wheat is cultivated in larger areas of the globe in different climates and its annual production is approximately 694 million tons5. The two common cultivated species are bread wheat (2n = 6×42) and durum wheat (4×28). The globally 95% of wheat is contributed by bread wheat while 5% is contributed by emmer (4×28), einkorn (2×14) and spelt (6×42)6.
Triticum aestivum (Bread wheat 2n = 6×42) has a hexaploid genome (AABBDD) of 17 Gb7,8. The evolutionary history of threshing-free wheat (tetraploid Durum and hexaploid bread wheat) crops is still uncertain9.
The hexaploid bread wheat of genome AABBDD has evolved from two different polyploidization events. The first event was completed about 0.5 million years ago when the diploid donor having A genome (T. urartu) hybridized with another species having B genome (Aegilops speltoides) resulting in tetraploid Triticum turgidum10. The second allo polyploidization event occurred (about 10,000 years ago) between the tetraploid T. turgidum spp., dicoccum and the diploid (D genome donor) Aegilops tauschii6,11.
Wheat provides nearly 20% of the diet calories and contains about 55% carbohydrates. The study showed that 100 gm of wheat comprises carbohydrates (78.10%), protein (14.70%), fat (2.10%) and minerals (2.10%). Wheat also contain a significant amount of thiamine and vitamin B12,13.
Botanically the wheat grain is called caryopsis having the pericarp and the true seed. About 72% of the protein is deposited in the seed endosperm. The wheat grains also contain riboflavin, pantothenic acid and sugars14. The aleurone and pericarp layer are used as nutritional sources of fibre and minerals like calcium, magnesium, phosphorus and potassium13.
Cytological the world’s wheat is classified into three main classes, diploid wheat, 2n = 2×14, chiefly used for fodder e.g. Triticum monococcum, Tetraploid or durum wheat, 2n = 4×28, e.g. Triticum dicoccoides, mostly used to make biscuits, pastries, noodle and pasta and Hexaploid or common/bread wheat, 2n = 6×42 which is used to make bread, nan, chapatti etc.15.
More than 200 different types of wheat diseases have been reported which are mostly pathogenic and infectious and are transmitted from plant to plant. About 10-16% of the world yield is lost due to plant diseases excluding the postharvest loss of 8-12% of the underdeveloped countries2,15.
Wheat is the most important cultivated crop that ranks first in acreage as well as production amongst all the cereals in Pakistan and all over the world. Population pressure urges food security. Due to the importance of wheat as a leading food crop in the farming system, many plant breeders are engaged in its improvement throughout the world16,17. There has been extensive research to pyramid such morphological traits that could partition adequate portion to grain yield resulting in high grain yield18,19. As the Khyber Pakhtunkhwa province comprises several ecological zones with different climates, the existing wheat cultivars are not giving us good yield because of inadequate moisture availability and an erratic distribution of rain in the province. Therefore, the research was proposed to study the morphological characterization of the germplasm and the production of their yield.
MATERIALS AND METHODS
The present research work was carried out in field conditions of Mansehra District during 2022-23. The 39 genotypes comprising 34 germplasm of synthetic wheat (Triticum aestivum) and 5 control lines of common wheat (Triticum aestivum) were grown in a field opposite the Department of Botany Hazara University Mansehra. Although, original source of these synthetic lines and their derivatives is CIMMYT, Mexico.
The purpose of the study was to observe diversity in plant height, peduncle length, spike length, awn length, leaf flag area, number of tillers per plant, number of spikelets per spike, spike density, seed color, number of grains per spike, 1000 grains weight, yield per plant, biological yield, harvest index were accounted during the study details of all these traits is given below. The 39 wheat germplasm were planted in Randomized Complete Block Design (RCBD) with three replications. Seeds were grown in a suitable field and environmental conditions. Before sowing the seeds, the field was cleared manually from the debris of other plants and then three rows were made, spacing between the rows was kept at 75 cm and the width was 12 cm and common agricultural practices for spring wheat in Pakistan were used.
Statistical analysis: All data from the parameters analyzed was assembled as a Microsoft Excel sheet and basic statistics such as mean, median, mode, variance range etc., were computed. While, Analysis of Variance (ANOVA) as well as treatment means were separated by the Least Significant Difference (LCD) test at p = 0.05 using SPSS. Correlation analysis and cluster analysis were also carried out using SPSS trial version 16.
RESULTS
The current research work was carried out in the experimental field opposite to the Department of Botany, Hazara University Mansehra, various morphological traits of 39 synthetic wheat including 5 control checks were studied (Table 1-4).
Days to flowering:
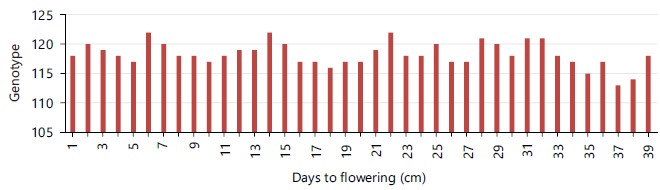
Analysis of Variance (ANOVA) revealed that days to flowering were highly significant among the 39 genotypes of synthetic wheat. Maximum days to flowering were observed in accession numbers 6, 14 and 22 which was 122 days while minimum days to flowering were observed in accession number 37 and accounted for 113 days (Fig. 1). The mean value of days to flowering was 118.79, standard deviation was 5.794, variance was 33.578 and coefficient of variance (C.V) was 4.67 (Table 1).
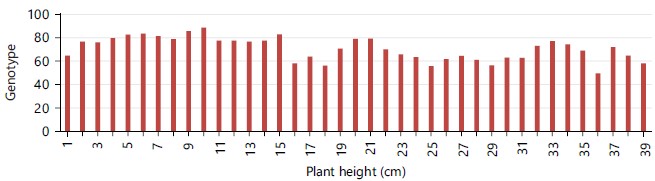
Plant height: Maximum plant height was observed in accession number 2, 15, 25, 29 and 34 and recorded as 93 cm while minimum plant height was observed in accession number 36 and recorded as 43.00 cm (Fig. 2). The mean plant height value was 70.69 cm, standard deviation was 10.94, variance was 119.698 and C.V was 8.59 (Table 1).
| Table 1: | Descriptive analysis of important agro-morphological traits | |||
Statistic |
Mean |
Statistic |
|||||
| Traits | Minimum |
Maximum |
Statistic |
Standard error |
Standard deviation |
Variance |
C.V |
| Days to flowering | 113 |
122 |
118.79 |
0.535 |
5.794 |
33.578 |
4.67 |
| Plant height | 43 |
93 |
70.69 |
1.011 |
10.94 |
119.698 |
8.59 |
| Peduncle length | 18 |
51 |
34.83 |
0.676 |
7.32 |
53.591 |
10.84 |
| Spike length | 6.7 |
15 |
10.66 |
0.158 |
1.712 |
2.932 |
7.37 |
| Awn length | 4 |
17 |
8.44 |
0.223 |
2.422 |
5.867 |
14.28 |
| Flag leaf area | 13 |
45 |
28.75 |
0.66 |
7.146 |
51.067 |
15.38 |
| Tillers per plant | 8 |
15 |
11.47 |
0.191 |
2.066 |
4.268 |
12.51 |
| Spikelet’s/spike | 13 |
22 |
17.13 |
0.171 |
1.856 |
3.447 |
7.05 |
| Spike density | 5 |
79 |
7.7 |
0.62 |
6.707 |
44.987 |
8.53 |
| Seed colour | 1 |
3 |
1.74 |
0.08 |
0.872 |
0.761 |
6.53 |
| Grains per spike | 20 |
91 |
62.23 |
1.125 |
12.168 |
148.08 |
10.34 |
| Days to maturity | 171 |
185 |
178.76 |
0.272 |
2.951 |
8.714 |
|
| C.V: Coefficient of variance | |||||||
| Table 2: | ANOVA show the agro morphology of different traits | |||
| Plant height | Peduncle length |
Spike length |
Awn length |
Flag leaf area |
Tillers per plant |
Spikelet’s per spike |
Grains per spike |
| 93.33cde | 41.667abcd |
14.000ab |
9.333cdefgh |
38.667bcde |
12.00bcdefghi |
17.000bcdefg |
42.333klmn |
| 75.00hijklmn | 38.667bcdefg |
10.667fghi |
8.833defghij |
29.667ghijk |
14.333abc |
17.000bcdefg |
45.000jklmn |
| 84.67defghi | 36.333cdefghij |
12.000bcdefgh |
7.333hijklm |
32.667cdefghij |
13.000abcdefg |
18.667abc |
48.333ijkl |
| 101.00abc | 42.333abcd |
8.667ij |
7.167ijklm |
33.000cdefghij |
12.333bcdefgh |
15.333fghij |
44.667jklmn |
| 81.00efghij | 44.333ab |
12.000bcdefgh |
9.333cdefgh |
47.667a |
13.333abcdef |
17.667abcde |
72.667abcd |
| 79.00fghijk | 32.333fghijklmn |
13.000abcde |
10.667bcd |
29.333ghijk |
11.667cdefghi |
17.667abcde |
37.000no |
| 75.33hijklm | 29.000jklmnopq |
11.333defgh |
8.333fghijklm |
34.667bcdefghi |
11.667cdefghi |
16.667cdefgh |
37.000no |
| 59.67opqr | 30.667hijklmno |
11.667cdefgh |
8.000ghijklm |
39.000bcd |
11.333defghi |
16.333defgh |
61.000efg |
| 54.00qr | 30.000ijklmno |
12.333bcdefg |
8.333fghijklm |
36.333bcdefgh |
10.333ghij |
17.333abcdef |
27.667o |
| 64.00mnopq | 30.333hijklmno |
11.167efgh |
7.167ijklm |
35.000bcdefghi |
10.333ghij |
14.667hij |
52.333ghij |
| 87.67cdefgh | 34.667defghijkl |
10.333ghi |
12.667b |
34.333bcdefghi |
13.000abcdefg |
18.667abc |
79.000a |
| 72.00ijklmno | 37.333bcdefghi |
7.333j |
15.667a |
32.667cdefghij |
14.333abc |
17.000bcdefg |
55.667fghi |
| 80.00efghij | 37.333bcdefghi |
11.667cdefgh |
8.500efghijkl |
35.000bcdefghi |
11.667cdefghi |
17.333abcdef |
56.333fg |
| 61.33nopqr | 28.333klmnopq |
12.667bcdef |
8.667defghijk |
32.333cdefghij |
12.000bcdefghi |
18.333abcd |
49.333hijkl |
| 66.00klmnopq | 35.000defghijkl |
13.667abc |
10.333cdef |
31.667defghij |
15.333a |
18.667abc |
64.667def |
| 68.33jklmnop | 27.667lmnopq |
13.667abc |
10.500cde |
34.000bcdefghi |
14.667ab |
19.333a |
64.333def |
| 80.67efghij | 32.000fghijklmn |
10.667fghi |
9.000cdefghi |
33.667bcdefghi |
11.667cdefghi |
14.333ij |
48.667ijkl |
| 75.33hijklm | 36.000cdefghijk |
13.000abcde |
8.333fghijklm |
38.333bcdef |
13.667abcde |
16.667cdefgh |
44.667jklmn |
| 114.00a | 49.000a |
11.667cdefgh |
9.333cdefgh |
40.333abc |
11.667cdefghi |
17.000bcdefg |
64.333def |
| 90.00cdefg | 35.333cdefghijkl |
15.000a |
8.333fghijklm |
37.333bcdefg |
12.333bcdefgh |
19.000ab |
47.000ijklm |
| 70.33jklmnop | 7.0000c |
11.667cdefgh |
8.000ghijklm |
28.000ijkl |
12.000bcdefghi |
16.333defghi |
40.000lmn |
| 52.67qr | 33.667efghijklm |
10.333ghi |
7.167ijklm |
27.333ijklm |
12.333bcdefgh |
16.333defghi |
28.000o |
| 100.00bc | 39.000bcdef |
10.233hi |
8.833defghij |
32.000defghij |
13.333abcdef |
17.000bcdefg |
74.667abc |
| 92.33cdef | 38.000bcdefgh |
10.333ghi |
8.500efghijkl |
23.333klm |
11.000efghi |
13.333j |
48.667ijkl |
| 96.33cd | 48.667a |
12.333bcdefg |
9.333cdefgh |
34.667bcdefghi |
12.000bcdefghi |
17.000bcdefg |
47.333ijklm |
| 91.00cdefg | 29.333jklmnop |
13.000abcde |
9.167cdefghi |
35.333bcdefghi |
14.333abc |
17.333abcdef |
51.000hijk |
| 85.33defghi | 31.000ghijklmno |
11.633cdefgh |
6.500lm |
31.333defghijk |
14.000abcd |
16.667cdefgh |
43.000jklmn |
| 84.33defghi | 34.667defghijkl |
12.000bcdefgh |
8.000ghijklm |
25.333jklm |
9.333ij |
16.000efghi |
38.333mn |
| 84.33defghi | 31.667fghijklmn |
11.333defgh |
8.333fghijklm |
30.667efghijk |
13.000abcdefg |
16.000efghi |
38.000mn |
| 72.67ijklmno | 26.667mnopq |
11.333defgh |
6.833jklm |
33.000cdefghij |
10.333ghij |
18.000abcde |
42.333klmn |
| 78.33ghijkl | 32.000fghijklmn |
11.433defgh |
6.833jklm |
30.667efghijk |
13.667abcde |
18.667abc |
52.000ghijk |
| 92.00cdefg | 43.000abc |
13.333abcd |
11.000bc |
41.333ab |
12.667abcdefg |
19.000ab |
76.667ab |
| 81.00efghij | 32.000fghijklmn |
11.667cdefgh |
9.333cdefgh |
30.000ghijk |
9.667hij |
17.667abcde |
36.667no |
| 113.67ab | 40.333bcde |
11.667cdefgh |
9.667cdefg |
32.667cdefghij |
11.667cdefghi |
15.000ghij |
69.000bcde |
| 69.00jklmnop | 21.333q |
8.000j |
7.333hijklm |
19.667m |
12.667abcdefg |
15.000ghij |
50.000hijk |
| 49.33r | 21.667pq |
8.833ij |
6.667klm |
20.333lm |
10.333ghij |
17.000bcdefg |
58.667fgh |
| 72.00ijklmno | 24.667nopq |
11.000efgh |
6.833jklm |
33.333bcdefghij |
10.667fghi |
17.667abcde |
64.667def |
| 64.67lmnopq | 25.667nopq |
10.333ghi |
7.233ijklm |
30.333fghijk |
9.333ij |
17.333abcdef |
65.000cdef |
| 58.00pqr | 23.667opq |
10.333ghi |
6.267m |
29.000hijk |
7.667j |
17.667abcde |
80.000a |
| Alphabets A to Z indicates the factors split in to levels in all possible combinations to compare different agromorphological traits | |||||||
| Table 3: | Correlations show different traits | |||
DF |
PH |
PL |
SL |
AL |
FLA |
NTPP |
NSPS |
SD |
SC |
GS |
|
| PH | -0.032 |
||||||||||
| PL | 0.225* |
0.612** |
|||||||||
| SL | 0.161 |
0.137 |
0.196* |
||||||||
| AL | 0.188* |
0.178 |
0.308** |
0.105 |
|||||||
| FLA | -0.06 |
0.255** |
0.421** |
0.408** |
0.210* |
||||||
| NTPP | 0.128 |
0.235* |
0.257** |
0.121 |
0.370** |
0.201* |
|||||
| NSPS | 0.136 |
-0.111 |
0.039 |
0.376** |
0.217* |
0.188* |
0.209* |
||||
| SD | -0.224* |
0.083 |
0.117 |
-0.161 |
-0.119 |
0.107 |
0.106 |
-0.064 |
|||
| SC | 0.097 |
-0.028 |
0.248** |
0.107 |
0.237* |
0.206* |
0.191* |
-0.005 |
-0.079 |
||
| GS | -0.305** |
0.163 |
0.063 |
-0.076 |
0.172 |
0.195* |
0.063 |
0.179 |
0.222* |
-0.036 |
|
| DM | 0.211* |
0.206* |
0.207* |
0.154 |
0.269** |
0.156 |
0.107 |
0.157 |
-0.008 |
0.108 |
0.102 |
| *Correlation is significant at the 0.05 level (2-tailed) and **Correlation is significant at the 0.01 level (2-tailed), DF: Days to flowering, PH: Plant height, PL: Peduncle length, SL: Spike length, AL: Awn length, FLA: Flag leaf area, NTPP: Number of tillers per plant, NSPS: Number of spikelets per spike, SD: Spike density, SC: Seed colour, GS: Grains per spike and DM: Days to maturity | |||||||||||
| Table 4: | Analysis of Variance (ANOVA) of wheat genotypes for different agro-morphological traits at 0.05 probability level | |||
| Sources | DF |
SS |
MS |
F |
P* |
|
| Days to flowering | Replicate | 2 |
8.17E-27 |
4.09E-27 |
||
| Genotypes | 39 |
479.692 |
12.6235 |
9.10E+29 |
0 |
|
| Error | 76 |
1.06E-27 |
1.39E-29 |
|||
| Total | 116 |
479.692 |
||||
| Plant height | Replicate | 2 |
31.5 |
15.752 |
||
| Genotypes | 39 |
27232.1 |
716.635 |
9.88 |
0 |
|
| Error | 76 |
5514.5 |
72.559 |
|||
| Total | 116 |
32778.1 |
||||
| Peduncle length | Replicate | 2 |
57.91 |
28.957 |
||
| Genotypes | 39 |
5234.32 |
137.745 |
6.07 |
0 |
|
| Error | 76 |
1725.42 |
22.703 |
|||
| Total | 116 |
7017.66 |
||||
| Spike length | Replicate | 2 |
2.788 |
1.3941 |
||
| Genotypes | 39 |
289.936 |
7.62989 |
4.81 |
0 |
|
| Error | 76 |
120.505 |
1.58559 |
|||
| Total | 116 |
413.229 |
||||
| Awn length | Replicate | 2 |
5.876 |
2.93778 |
||
| Genotypes | 39 |
369.185 |
9.71539 |
6 |
0 |
|
| Error | 76 |
123.104 |
1.6198 |
|||
| Total | 116 |
498.165 |
||||
| Flag leaf area | Replicate | 2 |
20.46 |
10.2308 |
||
| Genotypes | 39 |
3312.67 |
87.1754 |
3.46 |
0 |
|
| Error | 76 |
1914.87 |
25.1957 |
|||
| Total | 116 |
5248 |
||||
| Number of tillers per plant | Replicate | 2 |
2.786 |
1.39316 |
||
| Genotypes | 39 |
315.453 |
8.30139 |
2.9 |
0 |
|
| Error | 76 |
217.214 |
2.85807 |
|||
| Total | 116 |
535.453 |
||||
| Number of spikelet’s per spike | Replicate | 2 |
3.299 |
1.64957 |
||
| Genotypes | 39 |
211.299 |
5.5605 |
2.72 |
0.0001 |
|
| Error | 76 |
155.368 |
2.04431 |
|||
| Total | 116 |
369.966 |
||||
| Spike density | Replicate | 2 |
1.69E-29 |
8.42E-30 |
||
| Genotypes | 39 |
13.3333 |
0.35088 |
2.5 |
0 |
|
| Error | 76 |
10.6667 |
0.14035 |
|||
| Total | 116 |
24 |
||||
| Seed colour | Replicate | 2 |
8.28E-31 |
4.14E-31 |
||
| Genotypes | 39 |
98.6667 |
2.59649 |
21.14 |
0 |
|
| Error | 76 |
9.33333 |
0.12281 |
|||
| Total | 116 |
108 |
||||
| Grains per spike | Replicate | 2 |
77 |
38.487 |
||
| Genotypes | 39 |
21581.7 |
567.941 |
15.58 |
0 |
|
| Error | 76 |
2770.4 |
36.452 |
|||
| Total | 116 |
24429.1 |
||||
| Days to maturity | Replicate | 2 |
1.70E-26 |
8.51E-27 |
||
| Genotypes | 39 |
2956.31 |
77.7976 |
1.30E+30 |
0 |
|
| Error | 76 |
4.59E-27 |
6.04E-29 |
|||
| Total | 116 |
2956.31 |
||||
| *Significant at the 0.05 probability level and DF: Days to flowering | ||||||
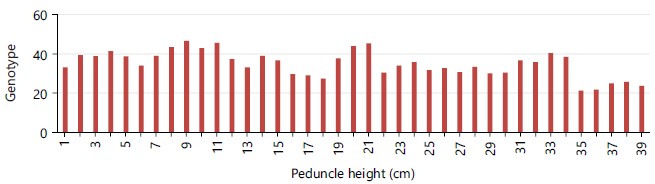
Peduncle length: Maximum peduncle length was observed in accession number 1 and recorded 51.00 cm while minimum peduncle length was observed in accession number 36 and recorded as 18.00 cm (Fig. 3). The mean peduncle length value was 34.83 cm, standard deviation was 7.32, variance was 53.59 and C.V was 10.84 (Table 1).
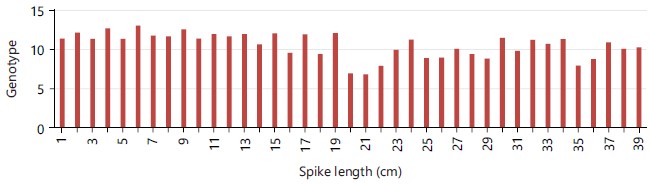
Spike length: Highest spike length was found in accession number 6 and 19 and recorded as 15.00 cm while the lowest spike length was observed in accession number 21 and recorded as 6.70 cm (Fig. 4). The mean spike length value was 10.66 cm, the standard deviation was 1.712, the variance was 2.93 and C.V was 7.37 (Table 1).
|
|
|
|
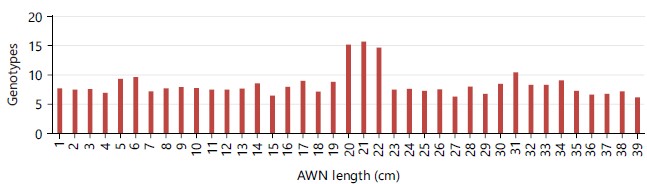
Awn length: Maximum awn length was found in accession number 12 and recorded as 17.00 cm while the minimum awn length was observed in accession number 27 and recorded as 4.00 cm (Fig. 5). The mean awn length value was 8.44 cm, standard deviation was 2.42, variance was 5.867 and C.V was 14.28 (Table 1).
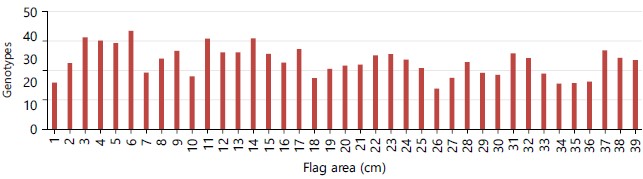
Flag leaf area: Maximum flag leaf area was observed in accession number 6 which was 43.00 cm while minimum flag leaf area was observed in accession numbers 35 and 36 which were 13.00 cm (Fig. 6). The mean value of flag leaf area was 28.75 cm, standard deviation was 7.146, a variance was 51.067 and C.V was 15.38 (Table 1).
|
|

|
Number of tillers per plant: Maximum number of tillers per plant was observed in accession numbers 5, 12, 15, 27, 31 which were 15 tillers while minimum number of tillers per plant was observed in accession number 10 and 28 which was 8 tillers (Fig. 7). The mean value of number of tillers per plant was 11.47 tillers, standard deviation was 2.066, variance was 4.268 and C.V was 12.51 (Table 1).
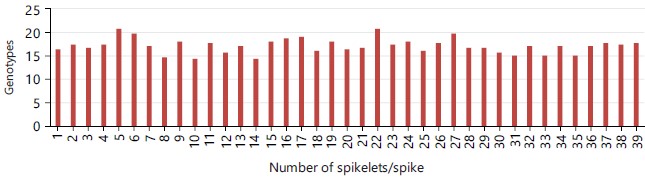
Number of spikelets per spike: Maximum number of spikelets per spike was observed in accession number 16 and recorded as 22 spikelet while a minimum number of spikelets per spike was observed in accession number 17 and recorded as 13 spikelets (Fig. 8). The mean value of spikelets per spike was 7.13 spikelet’s, standard deviation was 1.856, variance was 3.44 and C.V was 7.05 (Table 1).
Spike density: Highest spike density was found in accession number 12 which was very dense while the lowest spike density was observed in accession number 17 which was intermediate. The mean value of spike density was 7.70, standard deviation was 6.707, variance was 44.98 and C.V was 8.53 (Table 1).
Seed colour: Statistical analysis showed that the maximum seed colour was observed in accessions number 1, 2, 3, 6, 7, 8, 10, 11, 12, 13, 14, 15, 16, 17, 18, 19, 21, 22, 24, 25, 26, 27, 28, 29, 30, 31, 33, 34 which was purple in colour while minimum seed colour was observed in 4, 20, 23, 35, 36, 37, 38 and 39 accessions which were white in colour. The mean value of seed colour was 1.74, standard deviation was 0.872, a variance was 0.761 and C.V was 6.53 (Table 1).
|
Grains per spike: Maximum grains per spike were observed in accession number 11 and recorded at 91.00 grains per spike while minimum grains per spike were observed in accession number 22 and recorded as 20.00 grains per spike. The mean grains per spike value was 62.23, the standard deviation was 12.168, variance was 148.08 and C.V was 10.34 (Table 1).
Days to maturity: Maximum days to maturity were observed in accession number 23 and were counted as 185 days while minimum days to maturity were observed in accession number 10 and 35 were counted as 171 days. Mean value of days to maturity was 178.76 days. The standard deviation was 2.95 and variance was 8.714 (Table 1).
Thousand grains weight: Analysis exposed that the greatest value of thousand grain weight was observed in accession numbers 17 and 24 which were recorded as 50 g while the smallest value was observed in accession number 38 which was recorded as 30.24 g.
Biomass: After analyzing the data maximum biomass value was observed in accession number 25 which was 83 gm and the minimum value was observed in accession number 9 which was 32 g.
Yield per plant: Analysis showed that the maximum yield per plant was observed in accession number 11 which was 47.9609 g while the minimum yield per plant was observed in accession number 35 which was 12.4764 g.
Harvest index: Statistical analysis revealed that the greatest harvest index was observed in accession number 11 which was 69.0084 while lowest value was observed in accession number 7 which was 30.4491.
DISCUSSION
The current research work was carried out to investigate different morphological traits of 39 synthetic wheat including 5 control checks. These morphological traits include days to flowering, plant height, peduncle length, spike length, awn length, flag leaf area, number of tillers per plant, number of spikelets per spike, spike density, seed colour, grains per spike, grains weight, yield per plant, biomass, harvest index and days to maturity.
Wheat is one of the most important and widely cultivated crops having an annual production of 694 million tons. Wheat is used as a staple food in more than 40 countries5. Wheat is cultivated in larger areas than other cereals and modified to different climatic conditions. The current population of Pakistan is estimated to be 180 million, while in 2030 it is expected that it will be 300 million, that’s means there is a dire need to increase the production per area to fulfil the demands of a rapidly growing population. The country’s climatic conditions are well suited for the development of agriculture but still, the present indigenous production of wheat is not sufficient to meet the needs of the growing population. Low crop yield per unit area is due to, the non-availability of improved seeds, late sowing, improper cropping pattern, shortage of irrigation water and diseases etc.
The experiments conducted were aimed at analyzing the varieties morphologically to identify their yield potential. Yield ofwheatcan be increased by converting the barren and wasteland under cultivation or by increasing its yield per unit area20. Presently, it is not possible to increase the cultivation of wheat crops due to other competitive Rabi crops. The only alternative is to obtain a higher yield per unit area by growing high yielding varieties and better crop management.
Analysis of variance revealed that days to flowering were highly significant among the 39 genotypes of synthetic wheat. Maximum days to flowering was 122 days while minimum days to flowering was 113 days. Maximum plant height was observed in accession numbers 2, 15, 25, 29 and 34 and recorded as 93 cm. The same work which was supported by Ahmad et al.21 reported significant differences in wheat.
Statistical analysis showed that peduncle length among the genotypes was highly significant. Maximum peduncle length was observed in accession number 1 and recorded at 51.00 cm Statistical analysis shows that spike length was highly significant among all the genotypes. Highest spike length was found in accession number 20 and recorded as 15.8 cm. Khan et al.22 reported a significant positive correlation between spike length and plant height in wheat and also reported highly significant differences for spike length. Maximum awn length was found in accession number 12 and recorded as 17.00 cm. Maximum flag leaf area was observed in accession number 5 which was 45.00 cm. Maximum number of tillers per plant was observed in accession numbers 5, 12, 15, 27 and 31 which were 15 tillers. Maximum number of spikelets per spike was observed in accession number 16 and recorded as 22 spikelets.
Grains per spike were highly significant. Maximum grains per spike were observed in accession number 11 and recorded at 91.00 grains per spike. These results however contradicted the findings of Khan et al.22, who reported a positive direct effect of plant per spike (0.137) were found. Maximum days to maturity were observed in accession number 23 and were counted as 185 days. Analysis exposed that the greatest value of thousand grain weight was observed in accession numbers 17 and 24 which were recorded as 50 g. After analyzing the data maximum biomass value was observed in the accession number 25 which was 83 g. Analysis showed that the maximum yield per plant was observed in accession number 11 which was 47.9609 g. Statistical analysis revealed that the greatest harvest index was observed in accession number 11 which was 69.0084. Present results were in line with the finding of Khan et al.23, who also reported the non-significant differences in wheat genotypes. Such a non-significant difference between wheat and triticale showed that both traits have identical genetic backgrounds and hence can be collectively studied.
CONCLUSION
The 39 bread wheat genotypes were evaluated for morphological tests. Data recorded for morphological traits showed that different genotypes have the highest value in a variety of characters such as plant height, peduncle length, spike length, awn length, leaf flag area, number of tillers per plant, number of spikelets per spike, spike density, seed colour, number of grains per spike, 1000 grains weight, yield per plant, biological yield and harvest index. The ANOVA test shows significant differences among all the genotypes. These all genotype varieties give us better yield and we recommended these varieties of wheat for the future in order to get better wheat production.
SIGNIFICANCE STATEMENT
This study discovered the agromorphological characterization of 39 bread wheat genotypes for higher yield potential. Different genotypes showed the highest value in a variety of morphological characteristics. The statistical results showed significant differences among all the genotypes. This study will help the researchers to uncover the critical areas of different agromorphological characters and identification of wheat genotypes for better yield potential.
REFERENCES
- Foulkes, M.J., G.A. Slafer, W.J. Davies, P.M. Berry and R. Sylvester-Bradley et al., 2011. Raising yield potential of wheat. III. Optimizing partitioning to grain while maintaining lodging resistance. J. Exp. Bot., 62: 469-486.
- Chakraborty, S. and A.C. Newton, 2011. Climate change, plant diseases and food security: An overview. Plant Pathol., 60: 2-14.
- Kumar, A. and M. Sharma, 2011. Wheat genome phylogeny and improvement. Aust. J. Crop Sci., 5: 1120-1126.
- Mujeeb-Kazi, A. and G.P. Hettel, 1995. Utilizing Wild Grass Biodiversity in Wheat Improvement: 15 Years of Wide Cross Research at CIMMYT. CIMMYT, Mexico, ISBN: 9789686923087, Pages: 140.
- Matsuoka, Y., 2011. Evolution of polyploid Triticum wheats under cultivation: The role of domestication, natural hybridization and allopolyploid speciation in their diversification. Plant Cell Physiol., 52: 750-764
- Dubcovsky, J. and J. Dvorak, 2007. Genome plasticity a key factor in the success of polyploid wheat under domestication. Science, 316: 1862-1866.
- Blake, N.K., B.R. Lehfeldt, M. Lavin and L.E. Talbert, 1999. Phylogenetic reconstruction based on low copy DNA sequence data in an allopolyploid: The B genome of wheat. Genome, 42: 351-360.
- Huang, S., A. Sirikhachornkit, J.D. Faris, X. Su, B.S. Gill, R. Haselkorn and P. Gornicki, 2002. Phylogenetic analysis of the acetyl-CoA carboxylase and 3-phosphoglycerate kinase loci in wheat and other grasses. Plant Mol. Biol., 48: 805-820.
- Oliveira, H.R., M.G. Campana, H. Jones, H.V. Hunt and F. Leigh et al., 2012. Tetraploid wheat landraces in the Mediterranean basin: Taxonomy, evolution and genetic diversity. PLoS ONE,. 7.
- Feldman, M. and A.A. Levy, 2005. Allopolyploidy-A shaping force in the evolution of wheat genomes. Cytogenet. Genome Res., 109: 250-258.
- Salse, J., S. Bolot, M. Throude, V. Jouffe and B. Piegu et al., 2008. Identification and characterization of shared duplications between rice and wheat provide new insight into grass genome evolution. Plant Cell, 20: 11-24.
- Adams, M.L., E. Lombi, F.J. Zhao and S.P. McGrath, 2002. Evidence of low selenium concentrations in UK bread-making wheat grain. J. Sci. Food Agric., 82: 1160-1165.
- Shewry, P.R., S. Powers, J.M. Field, R.J. Fido and H.D. Jones et al., 2006. Comparative field performance over 3 years and two sites of transgenic wheat lines expressing HMW subunit transgenes. Theor. Appl. Genet., 113: 128-136.
- Topping, D., 2007. Cereal complex carbohydrates and their contribution to human health. J. Cereal Sci., 46: 220-229.
- Leonard, K.J. and L.J. Szabo, 2005. Stem rust of small grains and grasses caused by Puccinia graminis. Mol. Plant Pathol., 6: 99-111.
- Chen, X.M., 2005. Epidemiology and control of stripe rust [Puccinia striiformisf. sp.tritici] on wheat. Can. J. Plant Pathol., 27: 314-337.
- Hovmøller, M.S., S. Walter and A.F. Justesen, 2010. Escalating threat of wheat rusts. Science, 329: 369-369.
- Hale, I., X. Zhang, D. Fu and J. Dubcovsky, 2013. Registration of wheat lines carrying the partial stripe rust resistance gene Yr36 without the Gpc-B1 allele for high grain protein content. J. Plant Regist., 7: 108-112.
- Xie, C., Q. Sun, Z. Ni, T. Yang, E. Nevo and T. Fahima, 2003. Chromosomal location of a Triticum dicoccoides-derived powdery mildew resistance gene in common wheat by using microsatellite markers. Theor. Appl. Genet., 106: 341-345.
- Huang, X.Q., S.L.K. Hsam, F.J. Zeller, G. Wenzel and V. Mohler, 2000. Molecular mapping of the wheat powdery mildew resistance gene Pm24 and marker validation for molecular breeding. Theor. Appl. Genet., 101: 407-414.
- Ahmad, M., G.M. Chaudhry and M. Iqbal, 2002. Wheat productivity, efficiency, and sustainability: A stochastic production frontier analysis. Pak. Dev. Rev., 41: 643-663.
- Khan, A.L., M. Hamayun, S.A. Khan, Z.K. Shinwari and M. Kamaran et al., 2012. Pure culture of Metarhizium anisopliae LHL07 reporgrams soybean to higher growth and mitigates salt stress. World J. Microbiol. Biotechnol., 28: 1483-1494.
- Khan, I.A., J.D. Procunier, D.G. Humphreys, G. Tranquilli and A.R. Schlatter et al., 2000. Development of PCR-based markers for a high grain protein content gene from Triticum turgidum ssp. dicoccoides transferred to bread wheat. Crop Sci., 40: 518-524.
How to Cite this paper?
APA-7 Style
Naz,
S.S., Faisal,
S., Haq,
F., Ali,
N., Rahim,
A., Begum,
S. (2024). Characterization of Agromorphological Diversity in Synthetic Bread Wheat (Triticum aestivum L.) Genotypes Targeted for Higher Yield Potential. Asian Journal of Biological Sciences, 17(1), 110-120. https://doi.org/10.3923/ajbs.2024.110.120
ACS Style
Naz,
S.S.; Faisal,
S.; Haq,
F.; Ali,
N.; Rahim,
A.; Begum,
S. Characterization of Agromorphological Diversity in Synthetic Bread Wheat (Triticum aestivum L.) Genotypes Targeted for Higher Yield Potential. Asian J. Biol. Sci 2024, 17, 110-120. https://doi.org/10.3923/ajbs.2024.110.120
AMA Style
Naz
SS, Faisal
S, Haq
F, Ali
N, Rahim
A, Begum
S. Characterization of Agromorphological Diversity in Synthetic Bread Wheat (Triticum aestivum L.) Genotypes Targeted for Higher Yield Potential. Asian Journal of Biological Sciences. 2024; 17(1): 110-120. https://doi.org/10.3923/ajbs.2024.110.120
Chicago/Turabian Style
Naz, Syeda, Sidra, Shah Faisal, Faizul Haq, Naiz Ali, Abdur Rahim, and Sani Begum.
2024. "Characterization of Agromorphological Diversity in Synthetic Bread Wheat (Triticum aestivum L.) Genotypes Targeted for Higher Yield Potential" Asian Journal of Biological Sciences 17, no. 1: 110-120. https://doi.org/10.3923/ajbs.2024.110.120

This work is licensed under a Creative Commons Attribution 4.0 International License.