Determination of Electrochemical Properties of Electrolytes from Domestic Wastewater
-
Ayorinde Babatund Fasan


Department of Civil and Environmental Engineering, Federal University of Technology Akure, Ondo, Nigeria
Oluwaseun Adekoya Adelaja
Department of Chemistry, Federal University of Technology Akure, Ondo, Nigeria
Josiah Oladele BabatolaDepartment of Civil and Environmental Engineering, Federal University of Technology Akure, Ondo, Nigeria
Daniel Toyin OloruntobaDepartment of Metallurgical and Materials Engineering, Federal University of Technology Akure, Ondo, Nigeria
| Received 06 Sep, 2023 |
Accepted 22 Dec, 2023 |
Published 31 Mar, 2024 |
The erratic power supply in Nigeria has led to a decline in economic development and a low standard of living for many people within the country. Access to Nigeria’s electricity has been low for a very long time with no improvement in sight. One of the ways of resolving this problem is the provision of a microbial fuel cell (MFC) that can power some of the devices at home. This study investigates some of the electrochemical parameters of the electrolyte in microbial fuel cells. Three identical laboratory microbial fuel cells (MFCs) were constructed with a working volume of 1000 mL for each chamber. The MFCs were constructed in an H-shaped design with both chambers separated by cation ceramic membranes (CEM). Activated carbon materials obtained from white afara tree (Terminalia superba (TS)), bamboo tree (Bambusa vulgaris (BV)) and carbon cloth (CC) were used as the electrodes which were dipped into the reactors as MFC-1, MFC-2 and MFC-3, respectively. The electrochemical parameters of the electrolyte were studied. The maximum potential difference being obtained from MFC-1 (Terminalia superba (TS)) and MFC-3 (carbon cloth (CC)) occurred on day 5 which were 0.510 V and 0.95 V, respectively. The maximum potential difference obtained from MFC-2 (Bambusa vulgaris (BV)) occurred on day 15 which was 0.2 V. The results generated in this study showed that MFC-3 (carbon cloth (CC)) performed better in terms of voltage generation. The result of MFC-1 (Terminalia superba (TS)) showed that it performed better than MFC-2 (Bambusa vulgaris (BV) in terms of voltage generation. The results provide further information on the possibility of using MFCs for electricity generation.
| Copyright © 2024 Fasan et al. This is an open-access article distributed under the Creative Commons Attribution License, which permits unrestricted use, distribution, and reproduction in any medium, provided the original work is properly cited. |
INTRODUCTION
One of the most significant industries for the development of a country is the electric power sector. Any nation’s developmental reform depends on the electricity sector1. Nigeria’s epileptic power supply is a well-known truth given that it hinders the nation’s ability to develop economically and industrially2-4. Nigerians experience some of the worst kinds of power deprivation in the world, especially rural residents5. About 95 million Nigerians, or around 55% of the population, do not currently have access to grid electricity and those who do face epileptic supply more frequently than not6,7.
As a result of the high cost of energy, the cost of manufacturing has skyrocketed in the nation, many Nigerians spend a significant portion of their income on self-generation of electricity and the quality of life in the nation is suffering. This has had a negative impact on the nation’s socioeconomic development and technological advancement8. To address the issue of a persistent power outage in the nation, it appears that Nigeria has not made use of its abundant renewable energy resources to produce electricity9. Nigeria’s lack of reliable energy has slowed down economic expansion10. Nigeria produces about 4000 MW of power, which is insufficient to meet the needs of its population of over 206.14 million. The adoption of additional solutions, such as the conversion of wastes to energy to solve the economy’s lack of power supply, is also justified by the need to meet expanding demand11,12.
Over the years, a number of materials have been used and created, either for general use in various treatment methods or especially for MFC applications. The performance of an MFC in terms of microbial adhesion, electron transfer and electrochemical efficiency, as well as significantly affecting its power generation and treatment efficiency, depends on the selection of the appropriate electrode material for both the anode and the cathode13.
The conductivity of the materials used is also of great importance. The electrons released during the metabolic reactions of the microorganisms have to travel through the anodic electrode to the external circuit to reach the cathodic electrode. Therefore, materials with as low internal resistance as possible will make the flow of electrons easier14.
Additionally, the electrodes biocompatibility, robustness and stability must be guaranteed. The materials employed should prevent the microbial community from poisoning and should also be chemically stable in the bacterial culture and corrosion-resistant as microorganisms are what power generation depends on Wei et al.13.
The work focused on creating microbial fuel cell (MFC) reactors with carbon materials as electrodes and using the microbial fuel cells to produce energy.
MATERIALS AND METHODS
Study area: The study was carried out in March, 2019 at the Center for Renewable Energy Technology, Federal University of Technology, Akure, Ondo State, Nigeria.
Materials: All materials were sourced locally and they were domestic wastewater of 500 mL in each chamber obtained from staff club FUTA, 500 mL of distilled water obtained from chemistry laboratory FUTA, activated carbon electrodes from Terminalia Superba (TS) and activated carbon from Bambusa vulgaris (BV) were source locally, carbon cloth (CC) was obtained from China, masking tape and temporary marker were obtained from a local shop in Akure Nigeria.
Chemicals: All chemicals used were analytical grade and they were: Calcium carbonate, tryptone soya agar, glucose, monosodium phosphate dehydrate; all were obtained from PASCAL Akure.
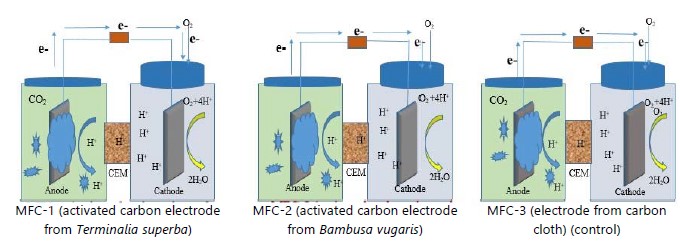
Preparation of electrode materials in microbial fuel cells: Three different types of electrodes were selected, which were Terminalia superba (MFC-1), Bambusa vulgaris (MFC-2) and carbon cloth (MFC-3). The MFC-3 with carbon cloth serves as a control for this research work. The results of MFC-1 and MFC-2 were compared with the results of MFC-3 to determine the best electrode that could conduct electricity for this project.
|
Moreover, Terminalia superba (TS) as carbon electrode material was purchased from a sawmill along Oke Aro Akure, Bambusa vulgaris (BV) as the second carbon material was collected inside the Federal University of Technology Akure and carbon cloth (CC) as the third carbon material was purchased from a local conductivity and were due to their chemical stability. Under the scope of this research work, the dimensions of carbon materials as electrodes being used were 70×60 mm and 40 mm of white afara Terminalia superba (TS), Bamboo Bambusa vulgaris (BV) and carbon cloth (CC) as MFC-1, MFC-2 and MFC-3, respectively.
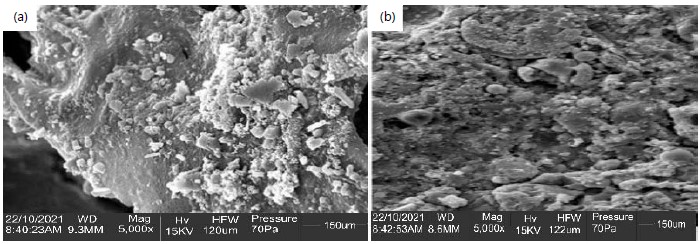
Sampling: As illustrated in Fig. 1(a-b), a ceramic membrane with a diameter of 0.03 m and a thickness of 0.01 m was placed between the anode and the cathode of each cell. A glue was used to connect each joint together monolithically. Scanning Electron Microscopy (SEM) was used to analyze the ceramic membrane’s surface morphology, as seen in Fig. 1(a-b). The SEM image analysis revealed a homogeneous structure like a honeycomb. Overall, the SEM image analysis reveals that the inclusion of onyx stone with a content of 120 and 122 μm produces uniform interconnected and ordered pores with a highly porous structure. The pores are produced due to the escapement of the gases and ceramic expansion by the formation of crystalline anorthite and gehlenite sintering. From these SEM observation, it can be said that the samples with an onyx stone content show isolated pores and good porosity if compared with other samples. This is due to the limited connections of the small pores in the SEM images.
However, the anode chambers were inoculated with activated sludge obtained from a river bed along with FUTA guest in which consists of electrogenic bacteria. The activated sludge was added with 5 g of glucose, 5 g of CaCO3 and 15 g of tryptone. These substrates serve as a medium for the electrogenic bacteria to grow. The inoculum was cultured for 5 days. Also, during the start-up period, the cathode chamber was filled with a 50 mM phosphorus buffer solution.
The wastewater feed was obtained from the Federal University of Technology Akure, Ondo State, Nigeria (FUTA) senior staff club restaurant (since this contains mostly dissolved carbohydrates and proteins the major components of the community diet). This volume (1.5 L) of wastewater was measured in the laboratory with a graduated measuring cylinder. The wastewater was taken to the laboratory to determine the chemical oxygen demand (COD) and Biochemical Oxygen Demand (BOD) which were 514.8 and 39.72 mg L–1, respectively, using standard methods (APHA, 1985). Also, the pH of the domestic wastewater was 6.68. The wastewater was divided into three, each containing 500 mL in each anodic chamber. The additional substrate which was 5 g of glucose, 15 g of CaCO3 and 5 g of tryptone were added to the 500 mL of wastewater.
|
The anode electrode was connected via copper wires to the cathode electrode which was deep inside 20 g potassium nitrate solution. The two chambers were joined with a ceramic membrane that was inter-connected. The dual-chambered systems were closed with a 39,000 Ω resistor in a series connection as shown in Fig. 2. The MFCs were maintained at 30°C. The microbial fuel cell voltage and other operating parameters were monitored for the 3-set-up every 5 days. The voltage was calculated via Ohm’s Law as shown in Equation 1:
V = I×R |
(1) |
Where:
| V | = | Voltage across the resistor (volts) | |
| I | = | Current calculated | |
| R | = | External resistance (Ω) |
The electrochemical performance of the MFCs was examined through various values, the most elemental expression of which is the amount of power produced, which can be expressed from Equation 2:
P=V×I |
(2) |
Where:
| P | = | Power produced (W-Watts) | |
| I | = | Current calculated (A-Amps) | |
| V | = | Voltage (V-Volts) measured across the resistor |
The voltage over external resistance were recorded by a multimeter. All measurements were saved in an excel file. The polarization curves were plotted to determine the internal resistance (Rin) and the power generation using the same external resistor (Rext). The external resistance was 39,000 for each measurement. Current density (CD) output generated were calculated as shown in Equation 3:
| (3) |
Where:
| CD | = | Current density | |
| I | = | Current generated | |
| A | = | Surface area of the electrode |
In a common practice to normalize power over the anodic electrode surface area, power density (PD) (W/m2), allows for different systems to be comparable and was calculated from Equation 4:
| (4) |
Where:
| PD | = | Power density | |
| I | = | Current across the resistance | |
| V | = | Voltage across the resistance | |
| A | = | Surface area of the electrode |
Reading of voltage and current was done quickly after they stabilized and polarization was done to get the biggest potential difference after one batch cycle. A variable resistor box (J 2322) with a range of 1 to 1 MΩ was used to change the external resistance over a variety of external loads in order to acquire the power density from the polarization test as well. The power density was expressed in watts per square meter (mW m–2) normalized to the expected surface area of the carbon anode (m2). It was looked at in relation to Equation 4. The voltage along and power density were plotted against the current density (CD) for each of the MFC. The internal resistance (Rin) was calculated from the slope of the polarization curve.
RESULTS AND DISCUSSION
The power and energy were also examined and electric voltage was utilized as a metric to track the long-term effectiveness of electricity generation in the MFCs. In general, the three MFCs’ voltage generation clearly differed from one another. The differences in potential energy between the three MFCs that are currently being produced were compared as shown in Table 1. The operating parameters of the three microbial fuel cells were compared as shown in Table 2.
Moreover, the generation of electrical energy is the primary purpose of MFC research with the electrode materials in the anode and cathode playing a critical role. The selection and development of activated carbon were targeted at introducing a cost-effective electrode material for use in MFCs. The successful inoculation of activated carbon indicated that an improvement in power generation can be achieved through post-inoculation cycles15-17.
Numerous cycles of operation are known to improve biofilm and increase the total power generated. Electric voltage was used as a parameter to monitor the long-time performance of electricity generation in the MFCs and the power and energy were also analyzed. In general, there was an obvious difference in voltage generation in the three MFCs. The three MFCs being produced were compared with their difference in potential energy.
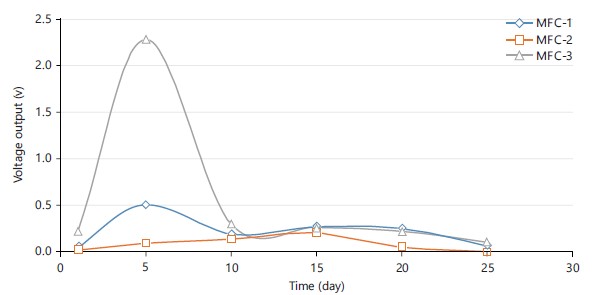
Voltage output across MFC-1, MFC-2 and MFC-3: The voltage output when the three MFCs were operating at a fixed external resistance of 39 K is shown in Fig. 3. The voltage outputs for the three MFCs were noted. During the commencement stage, the voltage output of MFC-1, MFC-2 and MFC-3 were only 0.047, 0.019 and 0.209 V, respectively. On day 5, MFC-1 and MFC-3's voltage output dramatically increased. On day 15 brought about a significant increase in voltage for MFC-2, which was noted. From day 1-5, the system’s maximum voltage gradually grew until it reached a maximum of 0.510 and 0.95 V for MFC-1 and MFC-3, respectively. The voltage then dropped to 0.105 V for MFC-3 and 0.060 V for MFC-1, respectively. The MFC-2 had a 0.20 V maximum voltage that dropped to 0 V on day 25.
Due to the exhaustion of the carbon supply in the anodic chamber, the voltage output dropped at the conclusion of each batch. The formation and enrichment of electrochemically active bacteria near the electrode may have contributed to the increase in voltage output, but the aging of microorganisms may have reduced microbial activity and caused a reduction in voltage output. Additionally, the depletion of the carbon supply in the anodic chamber caused the voltage output to fall at the conclusion of each batch. However, the profiles of the various potentials in Fig. 3 revealed that the primary limiting factor contributing to a reduced electricity output in MFC-1 and MFC-2 was the type of electrode being employed.
| Table 1: | Results of electrochemical parameters of digested wastewater in MFC-1, MFC-2 and MFC-3 in phase 1 | |||
| Days | Parameter | MFC-1 | MFC-2 | MFC-3 |
| 1 | Voltage (V) | 0.047 | 0.019 | 0.209 |
| Resistance (KΩ) | 39 | 39 | 39 | |
| Current (μA) | 1.21 | 0.487 | 5.36 | |
| Power (μW) | 0.0057 | 0.009 | 1.12 | |
| Current density (mA m–2) | 0.288 | 0.116 | 1.276 | |
| Power density (mW m–2) | 0.014 | 0.002 | 0.267 | |
| 5 | Voltage (V) | 0.51 | 0.09 | 0.95 |
| Resistance (KΩ) | 39 | 39 | 39 | |
| Current (μA) | 13.077 | 2.31 | 24.36 | |
| Power (μW) | 6.669 | 0.208 | 23.18 | |
| Current density (mA m–2) | 3.114 | 0.55 | 5.81 | |
| Power density (mW m–2) | 1.588 | 0.05 | 5.52 | |
| 10 | Voltage (V) | 0.187 | 0.136 | 0.295 |
| Resistance (KΩ) | 39 | 39 | 39 | |
| Current (μA) | 4.795 | 3.49 | 7.56 | |
| Power (μW) | 0.897 | 0.475 | 2.23 | |
| Current density (mA m–2) | 1.142 | 0.831 | 1.8 | |
| Power density (mW m–2) | 0.214 | 0.113 | 0.531 | |
| 15 | Voltage (V) | 0.27 | 0.2 | 0.26 |
| Resistance (KΩ) | 39 | 39 | 39 | |
| Current (μA) | 6.923 | 5.13 | 6.67 | |
| Power (μW) | 1.869 | 1.026 | 1.734 | |
| Current density (mA m–2) | 1.648 | 1.221 | 1.58 | |
| Power density (mA m–2) | 0.445 | 0.244 | 0.412 | |
| 20 | Voltage (V) | 0.25 | 0.05 | 0.22 |
| Resistance (KΩ) | 39 | 39 | 39 | |
| Current (μA) | 6.41 | 1.282 | 5.64 | |
| Power (μW) | 1.603 | 0.064 | 1.241 | |
| Current density (mA m–2) | 1.526 | 0.305 | 1.343 | |
| Power density (mA m–2) | 0.382 | 0.0152 | 0.295 | |
| 25 | Voltage (V) | 0.06 | 0 | 0.105 |
| Resistance (KΩ) | 39 | 39 | 39 | |
| Current (μA) | 1.538 | 0 | 2.69 | |
| Power (μW) | 0.092 | 0 | 0.282 | |
| Current density (mA m–2) | 0.366 | 0 | 0.64 | |
| Power density (mA m–2) | 0.0219 | 0 | 0.0674 |
| Table 2: | Comparison of the parameters of the three microbial fuel cells | |||
| Parameter | MFC-1 | MFC-2 | MFC-3 |
| CE (%) | 1.38×10⁻⁶ | 1.11×10⁻⁶ | 9.49×10⁻⁶ |
| COD removal (%) | 72.78 | 13.89 | 73.33 |
| Highest PD (mW m–2) | 2.107 | 47.619 | 19.714 |
| Internal resistance (Ω) | 6 | 9 | 25 |
| Open circle voltage (V) | 0.52 | 0.365 | 0.72 |
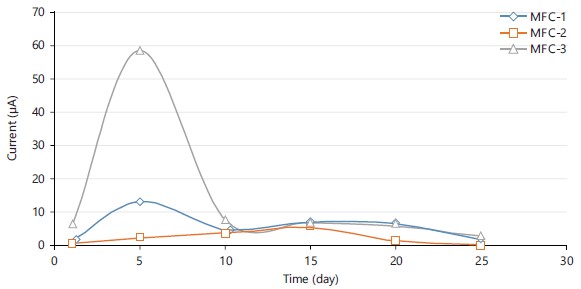
Current output across MFC-1, MFC-2 and MFC-3: Electric currents from the three cells were measured as a metric to track the long-term effectiveness of energy generation in the MFCs. Because the electrolyte in the cell at that time had low organic contents, MFC-3 generated more current than MFC-1 and MFC-2 combined.
|
|
The longevity and stability of a treatment technique, which was correlated with running costs, were crucial criteria. Biofilm developed on the anode electrode during the procedure and serves as an after-treatment for nitrogen and organics. The fact that we did not clean the anode electrodes at any point during the experiment suggests that biofilm formation was not as problematic as anticipated and had no impact on the production of energy.
Additionally, Fig. 4 displayed the present current generation with a 25 days hydraulic retention time (HRT). Due to the wide change in the COD wastewater characteristics and the solid contents in the microbial fuel cells (MFCs), the current generation fluctuated. It was investigated that the MFCs responded to fluctuations in two different scenarios. The first scenario simulated a circumstance in which the anode compartment would need to be emptied in order to be repaired; in this case, oxygen would enter the anode compartment following the removal of the water.

|
According to the size of the cathodic exposure, we noticed that the current generation in the three MFC-1, MFC-2 and MFC-3 recovered from oxygen intrusion in a few days as shown in Fig. 4.
This finding suggests that the MFCs could manage oxygen flux for a brief period of time and probably benefited from facultative microorganisms in the anode community. For hydraulic retention times (HRTs) of 25 days, current generated by MFC-1, MFC-2 and MFC-3 electrodes in household wastewater as electrolyte under a double chamber MFC was monitored at intervals of 5 days, as shown in Fig. 4. For MFC-1 and MFC-3, it was noticed that the produced current increased noticeably from day 1-5. These showed a declining trend from day 6-25, which was brought on by a decline in the organic loading rate. On day 5, MFC-1 and MFC-3 generated the greatest generated currents of 13.077 and 24.36 μA, respectively. On day 15, 5.130 μA, the greatest produced current for MFC-2, was recorded. As a result of the usage of an external resistance of 39 K, the current measured was in a closed circuit.
Power generation across MFC-1, MFC-2 and MFC-3: One of the most important aspects of energy production is proton transfer efficiency. Additionally, the cathode’s surface area has a significant impact on power output15. In addition, the MFC design, electrode material, substrate and other factors like pH and the microbial community might have an impact on the power generation. The power output as shown in Fig. 5 was enhanced by increasing substrate concentration, however, this was only possible when the substrate was not a limiting factor because power density would plateau at a given concentration. Furthermore, because pH and biofilm thickness have an impact on bacterial activity and electron transport, they may also limit an MFC’s ability to generate power.
In order to create a biofilm on the anode electrode, the MFCs were also run using glucose, tryptone and calcium carbonate as substrates. For MFC-1 and MFC-3, biofilm formation was successful after 5 days of MFC operation, whereas MFC-2 required 15 days for biofilm formation. The power generation efficiency of the three microbial fuel cells was also examined for comparison; all three MFCs were operated under identical conditions. The three MFCs with the same substrates were compared for electricity production.
On day 5, MFC-1 generated the highest power of 6.669 μW and on day 1, the lowest power of 0.057 μW. The generated power showed a clear upward trend from day 1-5 and then continued to trend upward and downward from day 6-25. Cell 2 generated a maximum power of 1.026 μW on day 15 and a low power of 0 μW on day 25.

|
Cell 3 generated a maximum power of 133.29 μW on day 5 and a minimum power of 0.282 μW on day 25. The generated power as shown in Fig. 5 was seen to have a noticeable upward trend from day 1-5 and a downward tendency from day 6-25. Due to the usage of an external resistance of 39 K, the power measured was under a closed-circuit power.
However, it was found that the maximum generated voltage, current and power shared comparable characteristics from days 1 through 5. They increase and decrease in a pattern that is likewise consistent with this trend. All of the measured parameters were found to have maximum values on day 5 while reaching their minimum levels on day 25.
Current density generation across MFC-1, MFC-2 and MFC-3: The maximum current density generated from Fig. 6 was MFC-3 which was 5.810 mA m–2 and this occurred on day 5; followed by MFC-1 which was 3.114 mA m–2 on day 5. The least current density being generated was MFC-2 which was 1.221 mA m–2 which occurred on day 15. This shows that MFC-3 gave the highest efficiency followed by MFC-1 and the least was MFC-2. This is due to the fact that MFC-3 had the highest porosity followed by MFC-1 and the least was MFC-2.
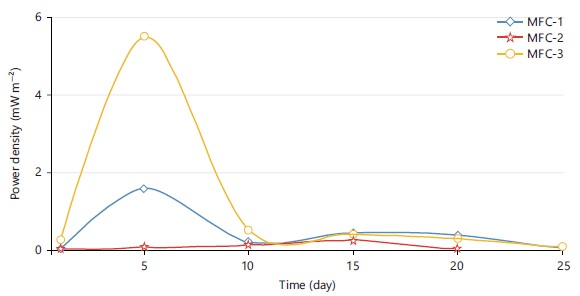
Power density generation across MFC-1, MFC-2 and MFC-3: The power densities of the MFC-1, MFC-2 and MFC-3 were shown in Fig. 7. The MFC-3 had the highest power density during the investigation, measuring at 5.520 mW m–2. This corresponds to the day 5 current density of 5.810 mA m–2. On day 5, MFC-1 reached a current density of 3.114 mA m–2, while its power density was 1.588 mW m–2. The MFC-2 device produced the least amount of power (0.24 mW m–2) and on day 15 it reached its maximum current density of 1.221 mA m–2.
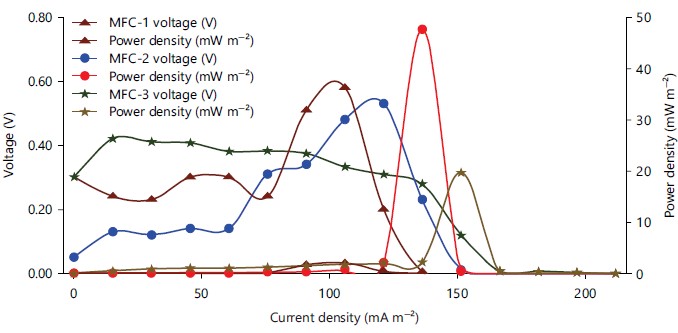
Polarization and internal resistance generation across MFC-1, MFC-2 and MFC-3: The performance of the microbial fuel cells can be directly reflected by the power density and polarization curve. All MFCs were, however, acclimated for 25 days at a 39,000 initial external resistance. On day 5, polarization analysis was performed to establish a situation with stable electrical generation and to establish the internal resistance. For the MFCs, polarization investigations were conducted by changing the external resistance from 1M to 1.
|
According to Fig. 8, the highest power densities recorded during polarization were 2.107 mW m–2 in MFC-1 at an external resistance of 38 K, 47.619 mW m–2 in MFC-2 at 270 and 19.714 mW m–2 in MFC-3 at 174. Internal resistance of the MFCs was 6, 9 and 25, respectively, as determined by the slope of the line from the voltage versus current density plot of MFC-1, MFC-2 and MFC-3. Even though all of the MFCs had the same amount of anode surface area, it was clear that MFC-2 had a higher power density than MFC-1 and MFC-3. Compared to MFC-1, MFC-3 performed better in terms of power density. Additionally, the MFC-1 showed extremely low internal resistance in comparison to the MFC-2 and MFC-3, suggesting improved substrate diffusion and fewer internal losses in bigger MFC. This presents an opportunity for future growth in anode volume and surface area to achieve a comparable power density, which is particularly exciting for scaling up MFC. This experience has shown that MFC-1 is capable of obtaining significant energy recovery efficiency when correctly constructed.
This will make it easier to use fewer MFCs to treat the same volume of wastewater or generate the appropriate amount of power, which will lower the cost of production. The open circuit potential (OCP) can be used to gauge the electrochemical reaction rates. Higher reaction rates were correlated with higher OCP values. The OCP for MFC-1, MFC-2 and MFC-3 was, respectively, 0.52, 0.365 and 0.72 V.
Coulombic efficiency of microbial fuel cells: Coulombic efficiency (CE) was calculated at the end of each batch to determine the amount of COD that was captured as electrical current as shown in Fig. 8. The CEs remained low throughout the study. The coulombic efficiency of MFC-1, MFC-2 and MFC-3 were 1.38×10⁻⁶, 1.11×10⁻⁶ and 9.49×10⁻⁶%, respectively. The highest CE was 9.49×10⁻⁶ % for MFC-3. The low CE in the three MFCs system suggested that only a small fraction of organic matter reduction contributed to power production18. Low CEs in MFCs operation also indicate that the majority of the energy was lost during the process of converting COD removal to electricity generation. The minimum coulombic efficiency indicates a better performance of electrodes that were used and the best electricity generation of the three MFCs. The CE could be affected by several factors, such as internal or external resistance and substrate concentration.
Competitive processes and bacterial growth can also cause a reduction of CE as bacteria are unable to use the electrode as an electron acceptor but are prone to utilize the substrate for other processes such as fermentation and/or methanogenesis. Glucose inside the microbial fuel cells resulted in low CE due to its fermentable nature, where more substrates were consumed by non-electrogenic bacteria.
|
CONCLUSION
The MFC-1 and MFC-3, the data from MFC-2 showed extremely low internal resistance, which suggests improved substrate diffusion and fewer internal losses in larger MFCs. This offers the potential for further increasing anode volume and surface area to achieve a comparable power density, which is particularly encouraging for scaling up MFC. This experience has shown that MFC-2 is capable of obtaining significant energy recovery efficiency when correctly constructed. This will make it easier to use fewer microbial fuel cells (MFCs), create the desired amount of power and lower the cost of production.
SIGNIFICANCE STATEMENT
The inadequacy of centralized and unreliable power supply, especially in the non-urbanized and urban regions of the Nigerian community, necessitate innovative microbial fuel cell technology for electricity generation from domestic wastewater. The research provide solutions of epileptic power generation in some of these areas by using alternative source of energy which is known as microbial fuel cell (MFC) devices. This device can be produced by many people living in these region since some of its components are readily available and affordable. It reduces the cost of solar batteries that is unaffordable by many Nigerian, hence it encourages the using of phones and the internet in some of these places.
ACKNOWLEDGMENTS
I would like to express my gratitude to all of my supervisors for their tremendous efforts and contributions to the success of this research output. I also thank the editorial team for all of their helpful remarks, which have helped to make the manuscript much better. I would also like to thank all the staff in water laboratory, Department of Civil and Environmental Engineering, Federal University of Technology Akure, Ondo State for all their technical support.
REFERENCES
- Okundamiya, M.S. and O. Omorogiuwa, 2015. Viability of a photovoltaic diesel battery hybrid power system in Nigeria. Iran. J. Energy Environ., 6: 5-12.
- Somefun, T., C. Awosope, A. Abdulkareem, J. Ojo, E. Amuta and T. Sanni, 2020. Cost implications analysis of grid supplied electricity and solar source of electricity in Nigeria. Telkomnika Telecommun. Comput. Electron. Control, 18: 3258-3265.
- Emmanuel, E.A., O.G. Oche and S.T. Anjide, 2022. Analysis of incidences of corruption in the Nigerian power sector: Implications on sustainable development. Int. J. Arts Social Sci., 5: 92-102.
- Omeiza, N.T., B. Ahmed and P. Patrick, 2023. Effects of erratic electricity supply on socio-economic activities of Nigeria: A study of Kaduna South, Kaduna State, Nigeria (2015-2019). KIU J. Social Sci., 9: 35-44.
- Ogundipe, A.A., O. Akinyemi and O.M. Ogundipe, 2016. Electricity consumption and economic development in Nigeria. Int. J. Energy Econ. Policy, 6: 134-143.
- Aliyu, A.S., A.T. Ramli and M.A. Saleh, 2013. Nigeria electricity crisis: Power generation capacity expansion and environmental ramifications. Energy, 61: 354-367.
- Aremu, J.O., 2019. Epileptic electric power generation and supply in Nigeria: Causes, impact and solution. J. Contemp. Res. Soc. Sci., 1: 73-81.
- Chu, S. and A. Majumdar, 2012. Opportunities and challenges for a sustainable energy future. Nature, 488: 294-303.
- Oke, Y., 2016. Essays on Nigerian Electricity Law. Princetion & Associations Publishing Company Limited, Ikeja, Lagos, ISBN: 9789785405606, Pages: 218.
- Aderoju, O.M., G.A. Dias and Z. Echakraoui, 2017. Assessment of renewable energy sources & municipal solid waste for sustainable power generation in Nigeria. IOP Conf. Ser.: Earth Environ. Sci., 95.
- Okeniyi, J.O., E.U. Anwan and E.T. Okeniyi, 2012. Waste characterisation and recoverable energy potential using waste generated in a model community in Nigeria. J. Environ. Sci. Technol., 5: 232-240.
- Akinyemi, O., U. Efobi, E. Osabuohien and P. Alege, 2019. Regional integration and energy sustainability in Africa: Exploring the challenges and prospects for ECOWAS. Afr. Dev. Rev., 31: 517-528.
- Wei, J., P. Liang and X. Huang, 2011. Recent progress in electrodes for microbial fuel cells. Bioresour. Technol., 102: 9335-9344.
- Scott, K. and E.H. Yu, 2015. Microbial Electrochemical and Fuel Cells: Fundamentals and Applications. Elsevier Science, Amsterdam, Netherlands, ISBN: 9781782423966, Pages: 410.
- Pandit, A., T. Sachdeva and P. Bafna, 2012. Drug-induced hepatotoxicity: A review. J. Appl. Pharm. Sci., 2: 233-243.
- Sun, G., D. de Sacadura Rodrigues, A. Thygesen, G. Daniel, D. Fernando and A.S. Meyer, 2016. Inocula selection in microbial fuel cells based on anodic biofilm abundance of Geobacter sulfurreducens. Chin. J. Chem. Eng., 24: 379-387.
- Sun, G., A. Thygesen and A.S. Meyer, 2015. Acetate is a superior substrate for microbial fuel cell initiation preceding bioethanol effluent utilization. Appl. Microbiol. Biotechnol., 99: 4905-4915.
- Velvizhi, G., R.K. Goud and S.V. Mohan, 2014. Anoxic bio-electrochemical system for treatment of complex chemical wastewater with simultaneous bioelectricity generation. Bioresour. Technol., 151: 214-220.
How to Cite this paper?
APA-7 Style
Fasan,
A.B., Adelaja,
O.A., Babatola,
J.O., Oloruntoba,
D.T. (2024). Determination of Electrochemical Properties of Electrolytes from Domestic Wastewater. Asian Journal of Biological Sciences, 17(1), 41-52. https://doi.org/10.3923/ajbs.2024.41.52
ACS Style
Fasan,
A.B.; Adelaja,
O.A.; Babatola,
J.O.; Oloruntoba,
D.T. Determination of Electrochemical Properties of Electrolytes from Domestic Wastewater. Asian J. Biol. Sci 2024, 17, 41-52. https://doi.org/10.3923/ajbs.2024.41.52
AMA Style
Fasan
AB, Adelaja
OA, Babatola
JO, Oloruntoba
DT. Determination of Electrochemical Properties of Electrolytes from Domestic Wastewater. Asian Journal of Biological Sciences. 2024; 17(1): 41-52. https://doi.org/10.3923/ajbs.2024.41.52
Chicago/Turabian Style
Fasan, Ayorinde, Babatund, Oluwaseun Adekoya Adelaja, Josiah Oladele Babatola, and Daniel Toyin Oloruntoba.
2024. "Determination of Electrochemical Properties of Electrolytes from Domestic Wastewater" Asian Journal of Biological Sciences 17, no. 1: 41-52. https://doi.org/10.3923/ajbs.2024.41.52

This work is licensed under a Creative Commons Attribution 4.0 International License.