Evaluation of C-Reactive Protein and Methaemoglobin of Alcoholics Resident in Bayelsa State
-
Emmanuel Chinedu Onuoha


Department of Haematology and transfusion Science, Faculty of Medical Laboratory Science, Federal University Otuoke, Bayelsa, Nigeria
Vivian Akudo MadukaDepartment of Haematology and transfusion Science, Faculty of Medical Laboratory Science, Federal University Otuoke, Bayelsa, Nigeria
| Received 29 Dec, 2023 |
Accepted 14 Feb, 2024 |
Published 31 Mar, 2024 |
Background and Objective: The goal of the World Health Organization (WHO) on alcohol public health is to reduce the health burden of harmful alcohol use and thus save lives, reduce sickness and avoid injury. Therefore, the study aimed to evaluate C-reactive protein and methaemoglobin of alcoholic residents in Bayelsa State which will aid us in forming a diagnostic tool for the diseases associated with alcohol consumption with good management outcomes. Materials and Methods: The study included 200 participants; comprising males and females within the age bracket of 15-65 years. A well-structured pre-tested questionnaire was administered to obtain information used to categorize participants into groups; Group 1(non-alcohol consumers (<1 drink monthly), Group 2 (occasional alcohol consumers (1-3 drinks/month), Group 3 (moderate alcohol consumers (1-5 drinks/week) and Group 4 (heavy alcohol consumers (>2 drinks/day). Results: The C-reactive protein showed a J-shaped pattern; was significantly higher in the control group (2.34±0.54 mg/dL) and lower in Group 3 (2.02±0.16 mg/dL) while methaemoglobin which was significantly higher when control (20.68±1.24) was compared to Group 4 (48.48±7.34) and Group 3 (28.96±3.82) but significantly lower when compared to Group 2 (9.45±2.03). Conclusion: The study concluded that chronic alcohol consumption could be a potential inflammation suppressant and can cause severe hypoxia.
| Copyright © 2024 Onuoha and Maduka. This is an open-access article distributed under the Creative Commons Attribution License, which permits unrestricted use, distribution, and reproduction in any medium, provided the original work is properly cited. |
INTRODUCTION
Alcohol causes mood swings and euphoria, decreased anxiety, enhanced sociability, sedation, cognitive impairment, memory, motor and sensory function and generalised central nervous system activity depression. Although ethanol is only one of the numerous forms of alcohol, it is the only type of alcohol utilised in alcoholic beverages or extensively used for recreational purposes; other alcohols, such as methanol and isopropyl alcohol, are thought to be harmful1.
The goal of the World Health Organization (WHO) on alcohol public health is to reduce the health burden of harmful alcohol use and thus save lives, reduce sickness and avoid injury. Alcohol has been identified as a causal factor in 60 forms of disease and a component cause in 200 others, as about 4% of the deaths are due to alcohol which is much greater than other disease2.
The C-reactive protein is a protein that is developed as an inflammatory response by hepatic cells and plays a critical role in the inflammatory process by opsonizing and activating the complementary system in response to IL-6 secretions3. Few data on possible associations between inflammatory markers and alcohol consumption are currently available. Some epidemiological evidence indicates that alcohol may be partly regulated by an anti-inflammatory action in the case of death due to ischemic heart diseases4.
Methaemoglobin is a metalloprotein haemoglobin in which the iron in the heme group is in the Fe3+ (ferric) state rather than the Fe2+ (ferrous) state of normal haemoglobin. Methemoglobin cannot bind oxygen, hence it cannot transport oxygen to the tissues. It's a dark blue-brown chocolate5. There is typically a trace of methemoglobin in the blood spontaneously, but the blood turns abnormally dark bluish-brown when present excessively. The methemoglobin reductase enzyme (a form of diaphorase) is NADH-dependent and is responsible for turning methemoglobin into hemoglobin. Several writers have published the direct impact on haematological parameters of alcoholic metabolite acetaldehyde and hemoglobin alcohol intake as a direct effect6,7. Moreover, acetaldehyde-modified protein epitopes are proposed as diagnostic indicators of alcohol abuse8-10.
Therefore, the study aimed to evaluate C-reactive protein and methaemoglobin of alcoholics resident in Bayelsa State, Nigeria will aid us in forming a diagnostic tool for the diseases associated with alcohol consumption with good management outcomes.
MATERIALS AND METHODS
Study area: This research was conducted in communities in Bayelsa State at coordinates 4.8678°N, 5.8987°E. Bayelsa State is a state in Southern Nigeria located between Delta and River States, having a total land area of around 10,773 km2 (4,159 sq mi). Its capital is Yenagoa, which is located at 4°55'29"N 6°15'51"E. The primary language spoken is Ijaw, with English serving as the official language. According to the 2006 census, the state was formed in 1996 from a portion of Rivers State and has a population of 1,704,515 people. Bayelsa State contains 8 Local Government Areas, with Yenagoa serving as the state capital. The research was carried out between April 2018 and May 2021.
Study population: The study population included male and female participants aged 15 to 65 who consumed alcohol and alcohol-based products, as well as persons who did not consume alcohol or alcohol-based products. The study population of 200 participants was divided into 4 groups:
• |
Group 1 consists of fifty (50) non-alcohol drinkers (one drink per month) |
|
• |
Group 2 consists of fifty (50) infrequent alcoholic drinkers (1-3 drinks per month) |
|
• |
Group 3 consists of fifty (50) moderate alcohol consumers (1-5 drinks per week) |
|
• |
Group 4 consists of fifty (50) heavy alcohol consumers (more than two drinks per day) |
Inclusion criteria
• |
All consenting individuals between the ages of 15 and 65 who use alcohol with no physical signs of sickness |
|
• |
All consenting adults who do not consume alcohol and are of legal drinking age |
Exclusion criteria
• |
Individuals with reported or confirmed cases of liver illness, myocardial infarction, inflammatory bowel disease, immunocompromised or on antiretroviral therapy, tuberculosis |
|
• |
Pregnant women or women using contraception |
|
• |
Individuals taking anticoagulant therapy, cytotoxic drugs, anti-diabetic therapy and anti-hypertensive therapy were excluded from the trial, as were non-consenting individuals. |
Sample size: The following formula, proposed by May and Looney11 was employed:
Where, ‘Z’ is the critical value and in a tailed least, this is equivalent to 1.95 'p' estimated prevalence of alcoholics in the Niger Delta region (3.2%). 'q' represents the probability, which is 1-p, 'd' is the absolute sampling error that can be accepted. It will be set at 5% more than the minimum sampling size N in this study:
A minimum sample size of 48 is required, but for this study, 50 individuals were selected at random in Bayelsa State localities. The test group consists of people who consume alcohol and alcohol-based goods, while the control group does not consume alcohol or alcohol-based products.
Collection of sample: The 5 mL of venous blood was taken aseptically with a 5 mL syringe and 3 mL dispensed into an Ethylene Diaminetetracetic Acid (EDTA) tube for methhaemoglobin assay. An assay was performed within 2 hrs of sample collection using whole blood to avoid hemolysis. For C-reactive protein, 2 mL was poured into a simple container. The C-reactive protein test sample was centrifuged at 4000 rpm for 15 min and the serum was extracted and refrigerated at -20°C until needed for analysis.
Aseptically, using a 5 mL syringe, 5 mL of venous blood was collected and 3 mL dispensed into Ethylene Diaminetetracetic Acid (EDTA) tube for methhaemoglobin analysis, analysis was done within 2 hrs of sample collection using whole blood to avoid hemolysis. As 2 mL was dispensed into a plain container for C-reactive protein. The sample for C-reactive protein test was centrifuged at 4000 rpm for 15 min, serum was separated and frozen at -20°C until when required for analysis.
Ethical approval: With a letter of introduction from the Head of Medical Laboratory Science Department, University of Benin, ethical clearance was obtained from the Bayelsa State Ministry of Health and Ethical Research Committee for the approval to collect samples from consenting individuals at communities in Bayelsa State.
METHOD OF ANALYSIS
Methemoglobin assay (colorimetric method): The methaemoglobin kit with catalog #TG2013 was used.
Principle: Schumm method which works on the principle says that methaemoglobin can be reduced by methaemoglobin reductase in the presence of sufficient NADPH to form a compound which is measured spectrophotomterically12.
C-reactive protein: Cobas C111 Siemen Berichron protein C reagent kit catalog number: ACN019.
Principle: Human CRP agglutinate with latex particles located with monoclonal CRP antibodies. The precipitate is determined turbimetrically. The Cobas C111 principle is based on absorption photometry for determining the amount of absorbance in a fluid.
Statistical analysis: Statistical Package for Social Sciences (SPSS) (Version 20.1 for Windows 10) was used to analyze data. The differences in the various parameters that were studied among the tests and control groups were evaluated using Kolmogorov-Simirnov Z statistics. One-way Analysis of Variance (ANOVA) was used to assess differences within the groups. Statistically significant values were determined at a 95% confidence level. Values were expressed as Mean and Standard Deviation correlation determined using Pearson correlation.
RESULTS
Table 1 shows Mean and Standard Deviation (SD) of C-reactive protein and methaemoglobin of participants. The highest mean and SD of C-reactive protein (2.34±0.54 mg/dL) were observed in control Group (non-alcohol consumers) while the least mean and SD C-reactive protein (2.02±0.16 mg/dL) were obtained in moderate alcohol consumers. The highest mean and SD methaemoglobin (48.48±7.34%) were obtained in heavy alcohol consumers and least mean and SD methaemoglobin (9.45±2.03%) were obtained in occasional alcohol consumers. One-way Analysis of Variance (ANOVA) showed a statistically significant difference (p<0.05) in comparison of the control mean and SD values of C-reactive protein and methaemoglobin to other participant Groups.
Table 2 shows the post hoc (Tukey’s LSD test) comparison of the effect of alcohol consumption on C-reactive protein and methaemoglobin among participants. It was compared at a statistical confidence level of 95%. The C-reactive protein was significantly reduced in the occasional alcohol and moderate alcohol consumer group when compared to control (non-alcohol consumers) but slightly elevated in the heavy alcohol consumer group indicating a J-shape pattern a contrast to methaemoglobin which was significantly increased when control was compared to Group 4 (heavy alcohol consumers) and Group 3 (moderate alcohol consumers) but significantly reduced when compared to Group 2 (occasional alcohol consumers). Intercomparison showed statistically significant difference except for C-reactive protein Group 1 vs Group 4, Group 2 vs Group 3 and Group 2 vs Group 4.
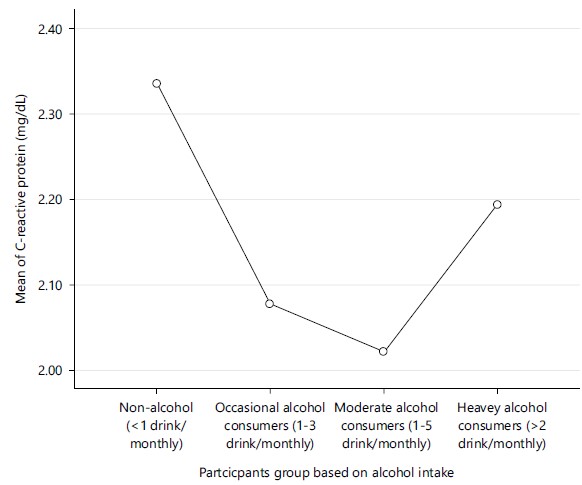
Figure 1 shows mean plot graph of participants groups against mean C-reactive protein value (mg/dL). The highest mean value of C-reactive protein (2.34 mg/dL) was observed among control Group (non-alcohol consumers) while the least mean value C-reactive protein (2.02 mg/dL) was obtained in moderate alcohol consumers.
| Table 1: | Mean and SD of C-reactive protein and methaemoglobin of participants | |||
| Groups (n = 200) | C-reactive protein (mg/dL) |
Methaemoglobin (%) |
| Group 1 | 2.34±0.54 |
20.68±1.24 |
| Group 2 | 2.08±0.19 |
9.45±2.03 |
| Group 3 | 2.02±0.16 |
28.96±3.82 |
| Group 4 | 2.19±0.56 |
48.48±7.34 |
| p-value | 0.001 |
0 |
| F-value | 5.758 |
731.752 |
| All values were expressed as Mean±SD for participants across all the groups, *Statistically significant difference between means as compared with control (p<0.05) Group 1 (control): Non-alcohol consumers (<1 drink monthly), Group 2: Occasional alcohol consumers (1-3 drinks/month), Group 3: Moderate alcohol consumers (1-5 drinks/week) and Group 4: Heavy alcohol consumers (>2 drinks/day) | ||
|
| Table 2: | Post hoc (Tukey’s LSD test) comparison of effect of alcohol consumption on C-reactive protein and methaemoglobin among participants | |||
C-reactive protein (mg/dL) |
Methaemoglobin (%) |
|
| Group 1 vs Group 2 | 0.002a |
0.000a |
| Group 1 vs Group 3 | 0.000a |
0.000a |
| Group 1 vs Group 4 | 0.084b |
0.001a |
| Group 2 vs Group 3 | 0.495b |
0.000a |
| Group 2 vs Group 4 | 0.158b |
0.002a |
| Group 3 vs Group 4 | 0.037a |
0.000a |
| aMean difference is significant at the 0.05 level, bMean difference is not significant at the 0.05 level, Group 1 (control): Non-alcohol consumers (<1 drink monthly) Group 2: Occasional alcohol consumers (1-3 drinks/month), Group 3: Moderate alcohol consumers (1-5 drinks/week) and Group 4: Heavy alcohol consumers (>2 drinks/day) | ||
Figure 2 shows mean plot graph of participants groups against mean methaemoglobin (%). The highest mean value of methaemoglobin (48.48%) was obtained in heavy alcohol consumers and least mean value of methaemoglobin (9.45%) was obtained in occasional alcohol consumers.
DISCUSSION
The findings of this work showed changes in C-reactive protein and methaemoglobin in all participant groups as shown in Fig. 1 and 2, especially in the heavy alcohol consumer group. Methaemoglobin, a metalloprotein of haemoglobin contains iron in the Fe3+ (ferric) state as the supposed Fe2+ (ferrous) of normal hemoglobin thereby losing the ability to transport oxygen which induces increased susceptibility to tissue hypoxia in mild exercise5.
The C-reactive protein is a protein that is produced by the liver cells as part of inflammatory response, it plays a vital role in the inflammatory process by involving opsonization and activation of the complement system in response to IL-6 secretion3. The findings showed that C-reactive protein was significantly reduced in occasional alcohol and moderate alcohol consumer groups when compared to the control (non-alcohol consumers) but slightly elevated in the heavy alcohol consumer group indicating a j-shape pattern a contrast to the observed effect in methaemoglobin which was significantly increased when control was compared to Group 4 (heavy alcohol consumers) and Group 3 (moderate alcohol consumers) but significantly reduced when compared to Group 2 (occasional alcohol consumers).

|
These findings suggested that increased alcohol consumption suppressed inflammation as observed in the reduction of C-reactive protein in occasional and moderate alcohol consumers but in an irregular J-shaped pattern but changes observed in methaemoglobin did not follow a pattern indicating modulatory interaction. The finding on association between alcohol consumption and C-reactive protein aligned with reports by May and Looney11 and Mitchelle et al.13 having a slight difference with reports by Imhof et al.4 and Paulson et al.14, who suggested that highest frequency drinkers are more likely than moderate drinkers to have elevated C-reactive protein levels. The mechanism of this interaction is not completely understood but some authors have suggested that alcohol derivatives could act as pseudo-immune inhibitors and neurotransmitter allosteric inhibitors especially due to the “acetaly” component of its derivative acetaldehyde15,13.
Furthermore, the findings of this study suggested the effect of alcohol consumption on metheamoglobin levels. Though there are limited publications on the effect of alcohol consumption on methaemoglobin especially because it is a spontaneous product, alcohol bases adducts and derivatives have been suggested to have an inhibitory effect on NADH-dependent enzyme methemoglobin reductase (a type of diaphorase) which is responsible for converting methemoglobin back to hemoglobin though the mechanism is not fully understood. This may endorse why methaemoglobin concentrations were highest in the heavy alcoholic consumer group in comparison to control6-7. This study implies that alcohol could be a potential inflammation suppressant however can cause severe hypoxia.
CONCLUSION
The alcohol can be used as a potential inflammation suppressant in the management of inflammatory diseases such as bowel inflammatory disorder. However, haematological parameters should be one of the major focuses in the management of such conditions to avoid severe hypoxia, which can lead to death. The study also recommends inflammatory markers and haematological investigation in liver disease associated with alcohol. It recommends further research on the pharmacological and molecular interactions of alcohol. As a result of insufficient funds, other useful inflammatory markers were not included in this study.
SIGNIFICANCE STATEMENT
The World Health Organization's (WHO) mission for alcohol public health is to minimise the health burden of harmful alcohol consumption, thereby saving lives, reducing disease and avoiding injury. The effects of alcohol consumption on C-reactive protein discovered that it can be a potential inflammation suppressant while on methaemoglobin, it can cause severe hypoxia. This can be of diagnostic assistance in the management of alcohol-associated diseases. This study will help the researcher uncover the critical area of consumption of alcohol severity that many researchers were not able to explore. Thus, a new theory on the effect of alcohol consumption on C-reactive protein and methaemoglobin may be arrived at.
REFERENCES
- Collins, S.E. and M. Kirouac, 2013. Alcohol Consumption. In: Encyclopedia of Behavioral Medicine, Gellman, M.D. and J.R. Turner (Eds.), Springer, New York, ISBN: 978-1-4419-1005-9, pp: 61-65.
- Ajayi, A.I., E.O. Owolabi and O.O. Olajire, 2019. Alcohol use among Nigerian university students: Prevalence, correlates and frequency of use. BMC Public Health, .19.
- Lee, Y.W., S.S. Kim, W.Y. Suh, Y.R. Seo and S. Lee et al., 2022. Association of high-sensitivity C-reactive protein and alcohol consumption on metabolic syndrome in Korean men. Int. J. Environ. Res. Public Health,. 19.
- Imhof, A., M. Froehlich, H. Brenner, H. Boeing, M.B. Pepys and W. Koenig, 2001. Effect of alcohol consumption on systemic markers of inflammation. Lancet, 357: 763-767.
- Beradai, M.A., S. Labib, S. Boujraf and M. Harandou, 2016. Acute methemoglobinemia due to ingestion of MAHIA wine brandy. Ann. Afr. Med., 15: 207-209.
- Edenberg, H.J. and J.N. McClintick, 2018. Alcohol dehydrogenases, aldehyde dehydrogenases, and alcohol use disorders: A critical review. Alcohol Clin. Exp. Res., 42: 2281-2297.
- Guo, R. and J. Ren, 2010. Alcohol and acetaldehyde in public health: From marvel to menace. Int. J. Environ. Res. Public Health, 7: 1285-1301.
- Setshedi, M., J.R. Wands and S.M. de la Monte, 2010. Acetaldehyde adducts in alcoholic liver disease. Oxid. Med. Cell. Longevity, 3: 178-185.
- Rungratanawanich, W., Y. Qu, X. Wang, M.M. Essa and B.J. Song, 2021. Advanced glycation end products (AGEs) and other adducts in aging-related diseases and alcohol-mediated tissue injury. Exp. Mol. Med., 53: 168-188.
- Snell, L.D., S.V. Bhave, L. Takacs and B. Tabakoff, 2016. Biological Markers of Substance Use: Focus on the Objective Assessment of Alcohol Exposure. In: The Oxford Handbook of Substance Use and Substance Use Disorders: Volume 2, Sher, K.J. (Ed.), Oxford University Press, Oxford, London, ISBN: 9780199381715, pp: 393-429.
- May, J.O. and S.W. Looney, 2022. On sample size determination when comparing two independent spearman or Kendall coefficients. Open J. Stat., 12: 291-302.
- Shihana, F., A.H. Dawson and D.M. Dissanayake, 2011. Method of stabilizing blood for the determination of methemoglobin. J. Clin. Lab. Anal., 25: 366-368.
- Mitchell, P.H., L. Powell, J. Blumenthal, J. Norten and G. Ironson et al., 2003. A short social support measure for patients recovering from myocardial infarction: The enrichd social support inventory. J. Cardiopulmonary Rehabil., 23: 398-403.
- Paulson, D., M. Shah, D. Herring, R. Scott, M. Herrera, D. Brush and R. Bassett, 2018. The relationship between moderate alcohol consumption, depressive symptomatology, and C‐reactive protein: The Health and Retirement Study. Int. J. Geriat Psychiatry, 33: 316-324.
- Mouliou, D.S., 2023. C-reactive protein: Pathophysiology, diagnosis, false test results and a novel diagnostic algorithm for clinicians. Diseases,. 11.
How to Cite this paper?
APA-7 Style
Onuoha,
E.C., Maduka,
V.A. (2024). Evaluation of C-Reactive Protein and Methaemoglobin of Alcoholics Resident in Bayelsa State. Asian Journal of Biological Sciences, 17(1), 102-109. https://doi.org/10.3923/ajbs.2024.102.109
ACS Style
Onuoha,
E.C.; Maduka,
V.A. Evaluation of C-Reactive Protein and Methaemoglobin of Alcoholics Resident in Bayelsa State. Asian J. Biol. Sci 2024, 17, 102-109. https://doi.org/10.3923/ajbs.2024.102.109
AMA Style
Onuoha
EC, Maduka
VA. Evaluation of C-Reactive Protein and Methaemoglobin of Alcoholics Resident in Bayelsa State. Asian Journal of Biological Sciences. 2024; 17(1): 102-109. https://doi.org/10.3923/ajbs.2024.102.109
Chicago/Turabian Style
Onuoha, Emmanuel, Chinedu, and Vivian Akudo Maduka.
2024. "Evaluation of C-Reactive Protein and Methaemoglobin of Alcoholics Resident in Bayelsa State" Asian Journal of Biological Sciences 17, no. 1: 102-109. https://doi.org/10.3923/ajbs.2024.102.109

This work is licensed under a Creative Commons Attribution 4.0 International License.