Genetic Variability Study in Ethiopian Sesame (Sesamum indicum L) Genotypes at Western Oromia
-
Feyera Takele


Plant Breeding, Bako Agricultural Research Center, P.O. Box 3, Bako, West Shoa, Ethiopia
Alemayehu DhabessaPlant Agronomy, Bako Agricultural Research Center, P.O. Box 3, Bako, West Shoa, Ethiopia
| Received 04 Jan, 2024 |
Accepted 26 Mar, 2024 |
Published 30 Jun, 2024 |
Background and Objectives: To understand the genetic nature of sesame yield and its components, estimation of genetic variability is critical in the plant improvement program. The current study was conducted to determine the genetic variability among Ethiopian sesame genotypes. Materials and Methods: The 64 sesame genotypes including standard check were evaluated under field conditions at Bako Agricultural Research Center. The study was conducted on an 8×8 simple lattice design. Each genotype was planted in 40 and 10 cm between rows of plants, respectively. All necessary plant and plot-based data were collected and analyzed by SAS 9.3 version software. Results: The study shows highly significant (p<0.01) differences among evaluated traits of sesame except for stem height. High phenotypic coefficient of variation, genotypic coefficient of variation and heritability were obtained from seed yield and harvest index. Medium phenotypic coefficient of variation and genotypic coefficient of variation with high heritability was observed from capsule per plant and branches per plant. However, low phenotypic and genotypic coefficients of variations were recorded from days to flowering, days to maturity and plant height. Branches per plant showed medium phenotypic and genotypic coefficients of variations and heritability. Conclusion: Harvest index, biomass yield and capsule per plant were used with seed yield to identify superior genotypes in sesame breeding programs.
| Copyright © 2024 Takele and Dhabessa. This is an open-access article distributed under the Creative Commons Attribution License, which permits unrestricted use, distribution, and reproduction in any medium, provided the original work is properly cited. |
INTRODUCTION
Sesame (Sesamum indicum L; 2 n = 26) is the most important oil crop in the world which is widely grown in tropical and sub-tropical agro-ecologies globally. The origin of sesame is considered in East Africa Ethiopia and India. It was domesticated about 5000 years old and was found in archaeological excavations in Harappa however, currently the crop is more distributed in some American countries such as Central America, South America and the USA. Sesame is considered a self-pollinated crop with <1% cross-pollination. The oil content of sesame seed is high (60%) when related to other oilseed. It is a rich source of protein (~24%), carbohydrates (~13.5%), vitamins, lignans (sesamin and sesamolin) and lipids1.
In Ethiopia,sesame seed is one of the most widely produced oilseed crops, accounting for 30% of total oilseed production in the country. About 543,236 small-holder and commercial farmers were engaged in sesame producing on 375,119.95 ha, 2,626,541.89 quintals with productivity of 0.7 ton/ha. The productivity of the crop is low and still compared with the yield potential of the crop up to 2000 kg/ha due to; lack of high yielder variety, high disease pressure, shattering of the pod, poor agronomic practices, drought, poor postharvest management and erratic rainfalls, poor extension system, lack of modern technology, market fluctuation, international price instability, highly concentrated export market, low price of the product and limited market access2,3. In plant breeding programs, studying genetic variability is an important prerequisite to developing superior cultivars. Understanding the heritability of a genetic trait is important in determining the response to selection as it indicates the extent of transmissibility of a character into future generations4. Some authors reported the presence of genomic variability among sesame genotypes for days to flowering, days to maturity, plant height (cm), branches per plant, capsule per plant, biomass yield, seed yield, thousand seed weight (g), harvest index and oil contents traits5-7. Therefore, the study aimed to assess the genetic variability among Ethiopian sesame (Sesamum indicum L) genotypes.
MATERIALS AND METHODS
Description of the study areas: The study was conducted in the Western Ethiopia Oromia region, at Bako Agricultural Research Center (BARC) (09°06'N Latitude and 37°09'E Longitude) during the 2019 main season. The BARC is situated at an altitude of 1650 m above sea level and receives a total rainfall of 1161.7 mm. The site has predominantly sandy clay soil and receives a relative humidity of 49.81%.
Experimental design and planting materials: The trial was laid out using an 8×8 simple lattice design with two replications. The study used 63 sesame genotypes and one standard check (Walin) as shown in Table 1. The planting materials were collected from Western Ethiopia and maintained at the Bako Agricultural Research Center. Each genotype was planted in 40 and 10 cm between rows of plants, respectively. Fertilizer NPS and urea were applied at the rate of 100 and 25 kg/ha, respectively at planting time. The remaining urea (25 kg/ha) was applied between 30 and 40 days after emergence. The details of the accessions collections used in the study were summarized in Table 1.
Data collection: All data were collected from both plant and plot basis. The following data were collected from the two central rows on a plant basis from 5 randomly selected plants: Plant height, stem height, number of branches per plant and number of capsules per plant days 50% flowering, days to 75% maturity, biomass yield, seed yield and harvest index (%) was collected on a plot basis.
Statistical analysis: All collected data was subjected to One-way Analysis of Variance (ANOVA) and done using Proc lattice and Proc GLM procedures of SAS version 9.3, according to simple lattice design. Mean comparisons among treatment means were conducted by the Least Significant Difference (LSD) test at 5% levels of significance
Estimation of genetic parameters: The phenotypic and genotypic coefficients of variation were estimated according to the following formula:
Genotypic variance (δ2g):
Where:
MSg |
= |
Mean square of genotype |
|
Mse |
= |
Is the mean square of error and |
|
r |
= |
Number of replications |
| Table 1: | Names and sources of 64 sesame genotypes used in the study | |||
| Entry no. | Accession |
Source |
Entry no. |
Accession |
Source |
| 1 | BK-014-1 |
BARC |
33 |
BK-118-1 |
BARC |
| 2 | BK-022-2 |
BARC |
34 |
BK-016-1 |
BARC |
| 3 | BK-035-1 |
BARC |
35 |
BK-123-1 |
BARC |
| 4 | BK-036-1 |
BARC |
36 |
BK-032-1 |
BARC |
| 5 | BK-013-1 |
BARC |
37 |
BK-124-1 |
BARC |
| 6 | BK-034-1 |
BARC |
38 |
BK-004-2 |
BARC |
| 7 | BK-078-1 |
BARC |
39 |
BK-079-1 |
BARC |
| 8 | BK-073-1 |
BARC |
40 |
BK-019-2 |
BARC |
| 9 | BK-038-1 |
BARC |
41 |
BK-006-1 |
BARC |
| 10 | BK-092-1 |
BARC |
42 |
BK-084-2 |
BARC |
| 11 | BK-109-3 |
BARC |
43 |
BK-084-1 |
BARC |
| 12 | BK-073-2 |
BARC |
44 |
BK-055-1 |
BARC |
| 13 | BK-022-3 |
BARC |
45 |
BK-072-1 |
BARC |
| 14 | BK-029-1 |
BARC |
46 |
BK-058-1 |
BARC |
| 15 | BK-061-1 |
BARC |
47 |
BK-128-1 |
BARC |
| 16 | BK-056-1 |
BARC |
48 |
BK-024-1 |
BARC |
| 17 | BK-053-2 |
BARC |
49 |
BK-024-2 |
BARC |
| 18 | BK-129-1 |
BARC |
50 |
BK-034-1 |
BARC |
| 19 | BK-026-1 |
BARC |
51 |
BK-028-1 |
BARC |
| 20 | BK-002-2 |
BARC |
52 |
BK-021-1 |
BARC |
| 21 | BK-086-1 |
BARC |
53 |
BK-098-1 |
BARC |
| 22 | BK-101-1 |
BARC |
54 |
BK-029-2 |
BARC |
| 23 | BK-075-1 |
BARC |
55 |
BK-080-2 |
BARC |
| 24 | BK-003-1 |
BARC |
56 |
BK-007-2 |
BARC |
| 25 | BK-120-1 |
BARC |
57 |
BK-068-1 |
BARC |
| 26 | BK-080-1 |
BARC |
58 |
BK-022-1 |
BARC |
| 27 | BK-026-2 |
BARC |
59 |
BK-002-1 |
BARC |
| 28 | BK-083-1 |
BARC |
60 |
BK-027-1 |
BARC |
| 29 | BK-085-1 |
BARC |
61 |
BK-018-1 |
BARC |
| 30 | BK-019-2 |
BARC |
62 |
BK-031-1 |
BARC |
| 31 | BK-102-1 |
BARC |
63 |
BK-125-1 |
BARC |
| 32 | BK-080-1 |
BARC |
64 |
Walin |
BARC |
Environmental variance (δ2e) = MSe:
Phenotypic variance (δ2p):
Where:
δ2g |
= |
Genotypic variance |
|
δ2e |
= |
Environmental variance and |
|
r |
= |
Number of replications |
Estimates of the coefficient of variation were obtained as follows.
Phenotypic coefficient of variation (PCV):
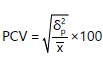 |
Where:
PCV |
= |
Phenotypic coefficient of variation |
|
δ2p |
= |
Phenotypic variance and |
|
x̄ |
= |
Population mean for the trait considered |
Genotypic coefficient of variation (GCV):
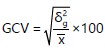 |
Where:
GCV |
= |
Genotypic coefficient of variation |
|
δ2g |
= |
Genotypic variance |
|
x̄ |
= |
opulation mean for the trait considered |
Estimation of heritability in a broad sense:
Broad sense heritability (H2) is expressed as the percentage of the ratio of the genotypic variance (δ2g) to the phenotypic variance (δ2p) and was estimated on a genotype mean basis as described by Acquaah8:
Where:
H2b |
= |
Broad sense heritability |
|
δ2g |
= |
Genotypic variance |
|
δ2p |
= |
Phenotypic variance |
RESULTS AND DISCUSSION
Effects of genotypes on tested sesame traits: The Analyses of Variance (Table 2) indicated that days to 50% flowering, days to maturity, plant height (cm), branches per plant, capsules per plant, biomass yield per hectare (kg/ha), seed yield per hectare (kg/ha) and harvest index (%) were highly significant (p<0.01) among tested sesame genotypes except stem height which was no significant indicating that the presence of considerable variation in the genetic materials. In line with this result, the existence of considerable variation among tested sesame genotypes was reported by Abate et al.7, Iqbal et al.9 and Singh et al.10.
Performance evaluation by mean and range values: The performance of tested sesame genotypes was presented by mean and range values in Table 3. Days to 50% flowering and days to maturity ranged from 65 to 73.67 with a mean of 68.26 and 122.67 to 134 with a mean of 128.19, respectively. Broader variability for days to flowering and maturity provides an opportunity to develop improved varieties for the environment with the variable rainfall season or crop growing season. In line with these results, wide variability among sesame genotypes under evaluated agro-ecologies was reported by Takele and Abera11 and Kiruthika et al.12. Plant height varied from 78.4 to 111.73 cm with a mean of 94.02 cm. Such wider variation could be best to select or develop a medium-sized variety to minimize yield loss due to lodging. The number of capsules per plant varied from 25.73 to 57.53 with a mean of 41.25 indicating that high variability was there among tested sesame genotypes. Seed yield per hectare ranged from 188.13 to 887.3 kg/ha with a mean yield of 490.77 kg/ha and harvest index ranged from 11.12 to 39.38% with a mean value of 20.22%. This showed the wide range of variability for all tested traits of sesame genotypes used in the present study.
Estimation of phenotypic and genotypic coefficients of variation: Phenotypic and genotypic coefficients of variation were estimated and presented in Table 3. Based on the result obtained, phenotypic coefficients of variation (PCV) ranged from 40.02% for harvest index to 3.49% for days to maturity and genotypic coefficients of variation (GCV) ranged from 35.55% for seed yield per hectare to 2.82% for days to maturity (Table 3). The PCV and GCV values greater than 20% are regarded as high, while values less than 10% are considered to be low and values between 10 and 20% are medium. Hence high values of PCV and GCV were obtained from seed yield, harvest index and biomass yield which account for 39.5% and 35.55, 40.02, 28.64, 32.7 and 20.03%, respectively (Table 3). Medium PCV and GCV values were obtained from branches per plant and capsules per plant. The medium to high PCV and GCV values indicated that observed variation between genotypes was due to their genetic difference rather than environmental influences. Similarly, medium to high PCV and GCV of some traits of tested sesame genotypes were reported by Abate et al.7 and Takele and Abera11.
| Table 2: | Mean square of analysis of variance for 9 traits of 64 evaluated sesame genotypes | |||
| Traits | MSg (Df:63) |
MSe (Df:126) |
CV (%) |
R2 |
| Days to flowering (Days) | 18.95** |
6.86 |
3.84 |
0.6 |
| Days to maturity (Days) | 33.14** |
6.91 |
2.05 |
0.71 |
| Plant height (cm) | 125.80** |
54.19 |
7.83 |
0.54 |
| Stem height (cm) | 38.87ns |
29.37 |
16.5 |
0.42 |
| Branches per plant (No) | 0.66** |
0.27 |
14.4 |
0.57 |
| Capsule per plant (No) | 105.50** |
21.44 |
11.23 |
0.71 |
| Biomass yield per hectare (kg) | 945840.40** |
429640 |
25.84 |
0.53 |
| Seed yield per hectare (kg) | 68026.41** |
7147 |
17.23 |
0.83 |
| Harvest index (%) | 98.99** |
31.93 |
27.95 |
0.61 |
| NB: **, *and ns Indicate highly significance (p<0.01), significant (p<0.05) and not significance, respectively, MSg: Mean square of genotype, MSe: Mean square of error, Df: Degree freedom, CV: Coefficient of variation and R2: R square | ||||
| Table 3: | Estimation of mean, range and other genetic parameters of tested sesame genotypes | |||
Range |
||||||
| Traits | Mean |
Min |
Max |
GCV |
PCV |
H2b (%) |
| Days to 50% flowering | 68.26 |
65 |
73.67 |
3.6 |
5.26 |
46.85 |
| Days to 90% maturity | 128.19 |
122.67 |
134 |
2.82 |
3.49 |
65.48 |
| Plant height (cm) | 94.02 |
78.4 |
111.73 |
6.36 |
10.09 |
39.79 |
| Branches per plant (No) | 3.58 |
2.73 |
4.53 |
12.33 |
18.96 |
42.32 |
| Capsule per plant (No) | 41.25 |
25.73 |
57.53 |
15.72 |
19.31 |
66.21 |
| Biomass yield per ha (kg/ha) | 2536.4 |
1414.6 |
3760.4 |
20.03 |
32.7 |
37.53 |
| Harvest index (%) | 20.22 |
11.12 |
39.38 |
28.64 |
40.02 |
51.22 |
| Seed yield per ha (kg/ha) | 490.77 |
188.13 |
887.3 |
35.55 |
39.5 |
80.99 |
| ha: Hectare, Min: Minimum, Max: Maximum, 2g: Genotypic variance and 2p: Phenotypic variance, GCV: Genotypic coefficients of variation, PCV: Phenotypic coefficients of variation and H2b (%): Broad sense heritability in percentage | ||||||
A trait with high phenotypic coefficients of variation and high genotypic coefficients of variation leads to effective simple selection as their phenotypic expression uses a good sign of genetic potential to deliver planting materials for any breeding program. Low values (<10%) of PCV and GCV were obtained from days to 50% flowering and days to maturity. Low values of PCV and GCV suggested that the traits are rendering to high environmental influences and hence lower opportunity exists for improvement of these traits through simple selection. Also, different authors reported low phenotypic and genotypic coefficients of variation for days to 50% flowering in the study area13.
Broad-sense heritability estimation: Development of high-yielding cultivars requires a thorough knowledge of the existing genetic variation for yield and its components14. From the result of the study, heritability ranges from 37.53% for biomass yield to 80.99 % for seed yield (Table 3). Heritability is classified as low (below 30%), medium (30-60%) and high (above 60%)15. The observed variability is a combined estimate of genetic and environmental causes, of which only the former one is heritable. However, estimates of heritability alone do not provide an idea about the expected gain in successive generations. Based on the above classification, most of the traits in this study were revealed medium (37.53-51.22%) to high heritability (65.48-80.99%). Seed yield per hectare (80.99%), number of capsules per plant (66.21%) and days to 90% maturity (65.48%) showed the highest broad sense heritability (Table 3).
Moderate to high broad sense heritability directed as expression of these traits were due to their genetic makeup and close correspondence between the genotypic and the phenotypic variation which shows less environmental influence on phenotypic expression of these traits. Similar results were reported from evaluated traits of sesame genotypes5,11. From the result, biomass yield per hectare (37.53%), plant height (39.79%), days to 50% flowering (46.85%), branches per plant (42.32%) and harvest index (51.22%) showed medium heritability values (Table 3).
In general, low genotypic coefficients of variation with medium heritability for plant height were recorded. On the contrary, high heritability with medium genotypic coefficients of variation (GCV) for plant height was reported by Mahla et al.13. Again medium genotypic coefficients of variation and heritability value were obtained from branches per plant. However, high genotypic coefficients of variation with high heritability were obtained from seed yield. These showed that expression of this trait is due to additive genes and leads to direct selection in breeding programs of variety development. Medium to high genotypic coefficients of variation and heritability of most evaluated traits reflect the importance of additive gene effects in their inheritance and expression. Therefore, the simple selection method is effective in the improvement of such and similar traits during variety development.
CONCLUSION
Generally, high significant differences among verified genotypes for all traits excluding stem height indicate the presence of high variability for yield and other related traits in the studied genotypes. Most of the tested traits showed medium to high PCV and GCV values as well as medium to high heritability. Therefore, significant genetic variability among tested genotypes was obtained in tested sesame genotypes which specifies the presence of a huge chance for more enhancement through selection and other breeding methodologies. Thus, the selection of high-yielding genotypes could make it possible to produce superior sesame varieties among the materials included in the present study.
SIGNIFICANCE STATEMENT
Genetic variability is the fundamental requirement of any crop breeding program to develop superior cultivars. Hence, this research is focused on a variability study on sesame genotypes for further improvement work on the crop. The study’s result shows highly significant genetic variability among tested sesame genotypes. Technology generation through variety improvement for food security starts with the assessment of existence and magnitude of genetic variability in a given commodity that is very helpful for the breeder to improve crop yield and production.
ACKNOWLEDGMENTS
My acknowledgment goes to Oromia Agricultural Research Institute and Bako Agricultural Research Center as well as team members of pulse and oil crops research are highly acknowledged for their valuable support during field works of the research.
REFERENCES
- Dossa, K., X. Wei, M. Niang, P. Liu and Y. Zhang et al., 2018. Near-infrared reflectance spectroscopy reveals wide variation in major components of sesame seeds from Africa and Asia. Crop J., 6: 202-206.
- Degefa, F.T., 2019. Review on sesame (Sesamum indicum L.) breeding in Ethiopia. J. Biol. Agric. Healthcare, 9: 39-45.
- Hagose, L.W., 2017. Strategic analysis of sesame (Sesamum indicum L.) market chain in Ethiopia a case of Humera District. Int. J. Plant Soil Sci., 15.
- Gayathridevi, G., P. Shanthi, R. Suresh, S. Manonmani, S. Geetha, K. Sathyabama and P. Geetha, 2023. Genetic variability, association and multivariate analysis for yield and yield parameters in rice (Oryza sativa L.) landraces. Electron. J. Plant Breed., 14: 991-999.
- Teklu, D.H., S.A. Kebede and D.E. Gebremichael, 2014. Assessment of genetic variability, genetic advance, correlation and path analysis for morphological traits in sesame genotypes. Asian J. Agric. Res., 8: 181-194.
- Hika, G., N. Geleta and Z. Jaleta, 2015. Genetic variability, heritability and genetic advance for the phenotypic traits in sesame (Sesamum indicum L.) populations from Ethiopia. Sci. Technol. Arts Res. J., 4: 20-26.
- Abate, M., F. Mekbib, A. Ayana and M. Nigussie, 2015. Genetic variability and association of traits in mid-altitude sesame (Sesamum indicum L.) germplasm of Ethiopia. J. Exp. Agric. Int., 9.
- Acquaah, G., 2012. Principles of Plant Genetics and Breeding. 2nd Edn., John Wiley & Sons, Hoboken, New Jersey, ISBN: 9781118313718, Pages: 760.
- Iqbal, A., U. Bhattacharyya, R. Akhtar and T. Dasgupta, 2018. Genetic diversity computation in sesame genotypes using morphological traits and genic SSR markers. Indian J. Genet. Plant Breed., 78: 348-356.
- Singh, A., R. Bisen and A. Tiwari, 2018. Genetic variability and character association in sesame (Sesamum indicum L.) genotypes. Int. J. Curr. Microbiol. Appl. Sci., 7: 2407-2415.
- Takele, F. and G. Abera, 2023. Variability study in Ethiopian sesame (Sesamum indicum L.) genotypes at Western Oromia. Int. J. Precis. Farming 1: 1-7.
- Kiruthika, S., S.L. Narayanan, C. Parameswari, M.L. Mini and P. Arunachalam, 2018. Genetic variability studies for yield and yield components in sesame (Sesamum indicum L.). Electron. J. Plant Breed., 9: 1529-1537.
- Mahla, N.U., P.K. Jagtap and H.R. Patel, 2024. Genetic variability and association among yield and yield related traits of sesame (Sesamum indicum L.) genotype. Int. J. Plant Soil Sci., 36: 197-206.
- Ghiday, T., A. Amogne, G. Tefera and M. Malede, 2017. Heritability, genetic advance and path coefficient analysis for grain yield and its component characters in soybean (Glycine max L. Merrill). Int. J. Res. Stud. Agric. Sci., 3: 1-11.
- Terfa, G.N. and G.N. Gurmu, 2020. Genetic variability, heritability and genetic advance in linseed (Linum usitatissimum L.) genotypes for seed yield and other agronomic traits. Oil Crop Sci., 5: 156-160.
How to Cite this paper?
APA-7 Style
Takele,
F., Dhabessa,
A. (2024). Genetic Variability Study in Ethiopian Sesame (Sesamum indicum L) Genotypes at Western Oromia. Asian Journal of Biological Sciences, 17(2), 221-227. https://doi.org/10.3923/ajbs.2024.221.227
ACS Style
Takele,
F.; Dhabessa,
A. Genetic Variability Study in Ethiopian Sesame (Sesamum indicum L) Genotypes at Western Oromia. Asian J. Biol. Sci 2024, 17, 221-227. https://doi.org/10.3923/ajbs.2024.221.227
AMA Style
Takele
F, Dhabessa
A. Genetic Variability Study in Ethiopian Sesame (Sesamum indicum L) Genotypes at Western Oromia. Asian Journal of Biological Sciences. 2024; 17(2): 221-227. https://doi.org/10.3923/ajbs.2024.221.227
Chicago/Turabian Style
Takele, Feyera, and Alemayehu Dhabessa.
2024. "Genetic Variability Study in Ethiopian Sesame (Sesamum indicum L) Genotypes at Western Oromia" Asian Journal of Biological Sciences 17, no. 2: 221-227. https://doi.org/10.3923/ajbs.2024.221.227

This work is licensed under a Creative Commons Attribution 4.0 International License.