Ecological and Health Risks Assessment of Levels of Heavy Metals in Drinking Water of Baghdad City, Iraq
| Received 17 Apr, 2024 |
Accepted 24 May, 2024 |
Published 31 Dec, 2024 |
Background and Objective: Public health is at risk in drinking water due to toxic substances which may have adverse health effects on humans. Based on untreated urban wastewater and manufacturing, farming and other man-made operations, drinking water supplies are vulnerable to contaminates in this region. Consequently, maintaining the health of drinking water is a rising concern in Iraq. The study aimed to estimate levels of heavy metals in the drinking water of Baghdad City, Iraq. Materials and Methods: To evaluate the quality of drinking water, the samples measured nine concentrations of heavy metals (Iron (Fe), Aluminum (Al), Lead (Pb), Zinc (Zn), Nickel (Ni), Cadmium (Cd), Fluoride (F), Manganese (Mn) and Copper (Cu) in drinking water samples from eleven water treatment plants (11WTPs) in Baghdad City to improve public health interventions. Results: Heavy metal concentrations were measured using an atomic absorption spectrometer (Model Phoenix-986 AAS) and contrasted with permissible limits established by Iraqi Guidelines and Water Chemical Limits Requirements (417/2011) and the World Health Organisation (WHO). Heavy metal concentrations were used to measure health risk assessments using the HPI and MI models. The results showed that mean HPI values for all seasons except in spring were 91,697 above the critical pollution index value of 100, indicating that 11WTPs are critically polluted with heavy metals. Conclusion: The MI results have been used to achieve the heavy metal toxicity among the sampling stations. Furthermore, no work was done on HPI and MI models in Baghdad city related to 11WTPs.
| Copyright © 2024 Al-Mayah and Al-Ghasham. This is an open-access article distributed under the Creative Commons Attribution License, which permits unrestricted use, distribution, and reproduction in any medium, provided the original work is properly cited. |
INTRODUCTION
Human beings are continuously subjected to numerous harmful chemicals in our atmosphere, which may contribute to complicated diseases such as endocrine destruction, genotoxic carcinogen, leukemia, dermatitis, enteritis, liver cirrhosis and respiratory diseases1. Both such man-made hazardous chemicals will eventually reach water source. Such toxic chemicals from domestic wastewater, irrigation, factories and other human activities penetrate waterways, streams and groundwater and can contaminate drinking water2-4. Contamination of drinking water with heavy metals is a public health issue because of their ingestion and human accumulation. Chemical pollutants in drinking water can present major threats to human safety directly via the intake, absorption and inhalation pathways5,6. Thus, in recent years, the study of water pollution by heavy metals has been the primary concern of environmental scientists5. Treatment plants (11WTPs) in Baghdad City have the capacity to generate 2.8 million liters of drinking water per day for consumers7,8. The majority of 11WTPs use conventional water treatment systems, which are divided into three phases: Pretreatment (filtration and aeration process), prechlorination (coagulation and flocculation process) and post-treatment (sedimentation and filtration process)9,10. In recent years, quality indices (WQIs) have been useful for health risk assessment by drinking water exposure to toxic heavy metals11. The possible effect of heavy metals on human health helps to quickly assess. The value of >1 for MI is a warning threshold even if the concentration of (Ci) for all elements is less than the maximum permitted value (MACi)12. The Metal Index has been used as an indicator for drinking water.
The metal index (MI) another index used for drinking water is a model that takes into consideration the possible additive effect of heavy metals on human health which helps to quickly assess the overall quality of drinking water and the value of >1 for MI is a warning threshold even if the mean concentration (Ci) for all elements is less than the maximum permitted value (MACi)12. The aim of study was to estimate levels of heavy metals in drinking water of Baghdad City, Iraq.
MATERIALS AND METHODS
Study site: The study field, located in middle Iraq's City of Baghdad, is situated between Latitudes 33°14'-33°25' N and Longitudes 44°31'-44°17' E, with millions of inhabitants covering a total region of 1000 km2. Water treatment plants (11WTPs) in Baghdad City relied on Table 1 for the treatment of raw water from the Tigris River for their drinking water.
Experimental methods: From September 2018 to August 2019, water samples were obtained monthly across four seasons, in the current analysis. After the delivery of drinking water to the houses through the water supply network, the treated water samples were obtained using clean polyethylene bottles from the eleven treatment plants (11WTPs). All drinking water samples for heavy metals (Fe, Al, Cr, Pb, Zn, Ni, Cd, Ag, Mn and Cu)13.
Calculations of the model HPI: The evaluation of water quality works based on heavy metal concentration. The heavy metal pollution index (HPI) was formulated by Dede et al.12:
| (1) |
Where:
| Wi | = | Unit weightage of the ith parameter | |
| K | = | Constant of proportionality can be calculate from formula proposed by Al-Dulaimi and Younes5 and Al-Mayah et al.6 | |
| Si | = | Iraqi accepted drinking water quality standard prescribed by (417/2011) as shown in Table 1 |
The quality rating (Qi ) of the parameter is calculated by:
| (2) |
Where:
| Mi | = | Monitored value of heavy metal of ith parameter can be obtained from Table 3 | |
| Ii | = | Ideal value of the ith parameter by Eldaw et al.14, Mensoor and Said15 | |
| Si | = | Iraqi accepted drinking water quality standard prescribed by Issa and Alshatteri11 | |
| − | = | Indicates numerical difference of the two values, ignoring the algebraic sign |
| Table 1: | Features of drinking water treatment plants (11WTPs) in Baghdad City, involved in this study | |||
| ID | Name of station (WTPs) | Design capacities | Location (area) | Year of establishment | Network situated |
| 1 | Al-Karkh | 1,300,000 m3/day | Al-Karkhside | 1984 | Medium |
| 2 | Sharq Dijla | 90,000 m3/day | Al-Rusafa side | 1978 | Medium |
| 3 | Al-Sader | 90,000 m3/day | Al-Rusafa side | 2013 | Good |
| 4 | Al-Baldiat | 225,000 m3/day | Al-Rusafa side | 2012 | Good |
| 5 | Al-Kadhimiya | 112,5000 m3/day | Al-Karkhside | 2011 | Good |
| 6 | Al-Karama | 220,000 m3/day | Al-Karkhside | 1953 | Medium |
| 7 | Al-Wathba | 130,000 m3/day | Al-Rusafa side | 1932 | Bad |
| 8 | Al-Qadisya | 140,000 m3/day | Al-Karkhside | 1965 | Medium |
| 9 | Al-Dora | 113,000 m3/day | Al-Karkhside | 1982 | Medium |
| 10 | Al-Wahda | 72,000 m3/day | Al-Rusafa side | 1959 | Medium |
| 11 | Al-Rasheed | 90,000 m3/day | Al-Rusafa side | 1963 | Bad |
| Table 2: | Illustration of MI-WQI categories | |||
| MI-WQI values | Rating | Class |
| <0.3 | Very pure | I |
| 0.3-1.0 | Pure | II |
| 1.0-2.0 | Slightly affected | III |
| 2.0-4.0 | Moderately affected | IV |
| 4.0-6.0 | Strongly affected | V |
| >6.0 | Seriously affected | VI |
Finally, the HPI model is then calculated as follows:
| (3) |
Where:
| Wi | = | Unit weightage of the ith parameter | |
| Qi | = | Quality rating |
Calculations of the model MI: The metal index (MI) was proposed by Caeiro et al.10. This index can be calculated value manually by the following equation:
Where:
| MI | = | Metal index | |
| Ci | = | Mean concentration of each metal | |
| MAC | = | Maximum allowed concentration for each metal that can be obtained from the standard (Table 2) |
RESULTS AND DISCUSSION
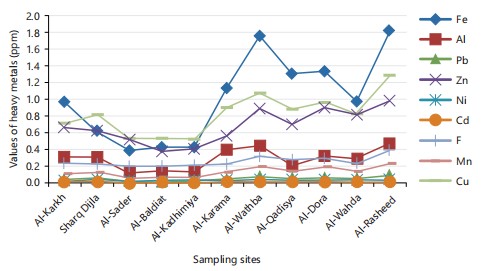
Spatial and temporal variations of heavy metals concentration: The findings of this study indicate that drinking water content in most 11WTPs in Baghdad City is not appropriate for customers. Annual mean heavy metal concentrations in drinking water samples follow the order of Fe>Cu>Zn>Al>F>Mn >Pb>Ni>Cd as shown in Table 3 and Fig. 1. The results were compared with the chemical limits of Iraqi Criteria and Standards of Water (417/2011) and the drinking water quality standards of the World Health Organization (WHO)14,15. Most heavy metal concentrations in drinking water exceeded the permissible limits except for Zn and F for Iraqi requirements and Zn, Ni, F, Mn and Cu for WHO standards. High concentrations of heavy metal in 11WTPs are due to the source of drinking water from the Tigris River primarily induced by untreated sewerage inflows from rural, residential and industrial establishments. On the other hand, lack of worker experience in the 11WTPs and differences in purification process efficiency as well as rehabilitation and corrosion of distribution network pipes were the main reasons why the concentrations of heavy metals in drinking water increased. Exposure to elevated amounts of heavy metals in drinking water can contribute to acute and persistent poisoning, such as osteodystrophy, Alzheimer's disease, organ injury, lung cancer, cirrhosis, harm to the liver, nervousness and even death16-18.
|
| Table 3: | Annual mean of heavy metal concentrations at different WTPs of Baghdad City | |||
| ID | WTPs | Fe (ppm) | Al (ppm) | Pb (ppm) | Zn (ppm) | Ni (ppm) | Cd (ppm) | F (ppm) | Mn (ppm) | Cu (ppm) |
| 1 | Al-Karkh | 0.964 | 0.312 | 0.037 | 0.657 | 0.0274 | 0.0035 | 0.229 | 0.114 | 0.708 |
| 2 | Sharq Dijla | 0.616 | 0.305 | 0.0423 | 0.622 | 0.0319 | 0.0037 | 0.225 | 0.126 | 0.814 |
| 3 | Al-Sader | 0.384 | 0.118 | 0.025 | 0.515 | 0.0215 | 0.0031 | 0.192 | 0.057 | 0.529 |
| 4 | Al-Baldiat | 0.419 | 0.129 | 0.0173 | 0.37 | 0.0233 | 0.0034 | 0.194 | 0.073 | 0.528 |
| 5 | Al-Kadhimiya | 0.427 | 0.133 | 0.0283 | 0.398 | 0.0218 | 0.0033 | 0.206 | 0.065 | 0.526 |
| 6 | Al-Karama | 1.131 | 0.39 | 0.042 | 0.558 | 0.0298 | 0.0041 | 0.221 | 0.128 | 0.903 |
| 7 | Al-Wathba | 1.748 | 0.443 | 0.0685 | 0.882 | 0.0364 | 0.0047 | 0.319 | 0.194 | 1.067 |
| 8 | Al-Qadisya | 1.2989 | 0.217 | 0.0496 | 0.695 | 0.0325 | 0.0042 | 0.274 | 0.146 | 0.884 |
| 9 | Al-Dora | 1.324 | 0.326 | 0.0588 | 0.891 | 0.0336 | 0.0044 | 0.291 | 0.185 | 0.962 |
| 10 | Al-Wahda | 0.965 | 0.285 | 0.0453 | 0.817 | 0.0326 | 0.0038 | 0.228 | 0.136 | 0.824 |
| 11 | Al-Rasheed | 1.821 | 0.472 | 0.0821 | 0.975 | 0.0385 | 0.0049 | 0.381 | 0.234 | 1.285 |
| WHO standard | 0.3 | 0.2 | 0.01 | 3 | 0.07 | 0.003 | 1.5 | 0.4 | 2 | |
| (2017)15,26 | 0.3 | 0.2 | 0.01 | 3 | 0.02 | 0.003 | 1 | 0.1 | 1 |
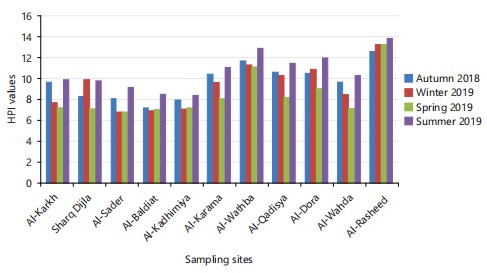
Heavy metal pollution index (HPI): The summary of drinking water sample HPI model values from all 11 sampling sites (11WTPs) and all seasons is presented in Table 4-7. Based on the estimated HPI model of the studied heavy metals by drinking water consumption, mean values for all seasons have adverse health effects for consumers except for spring (HPI = 91.697), because the values obtained are above the critical pollution index of 100. In the order of Al-Rasheed>Al-Wathba>Al-Dora>Al-Qadisya>Al-Karama> Al-Wahda>Sharq Dijla>Al-Karkh>Al-Kadhimiya>Al-Baldiat>Al-Sader, HPI indices for WTPs in the research region were identified. The actual cause for this fluctuation in the HPI values at these WTPs was variations in concentrations of heavy metals, outdated network pipes, irregular repairs, industrial runoff and other intense human activities.
For the same reasons, it was noted in Fig. 2 that the water treatment plants (WTPs) deteriorate in the downstream trend of the Tigris River from north to south within the City of Baghdad. Furthermore, previous studies19-21 supported the current study (Table 8).
| Table 4: | Calculate HPI-WQI of WTPs during autumn (September, October, November, 2018) | |||
| Qi | |||||||||||
| WTPs | Fe (ppm) | Al (ppm) | Pb (ppm) | Zn (ppm) | Ni (ppm) | Cd (ppm) | F (ppm) | Mn (ppm) | Cu (ppm) | SUM WIQI |
HPI-WQI value |
| Al-Karkh | 238 | 101.5 | 330 | 31.73 | 105 | 130 | 95.2 | 87 | 93.6 | 266.6 | 9.581 |
| Sharq Dijla | 240 | 135 | 230 | 24.5 | 90 | 106.7 | 9.9 | 73 | 89.3 | 229.7 | 8.256 |
| Al-Sader | 124 | 68.5 | 190 | 25.03 | 110 | 106.67 | 9.4 | 64 | 58.3 | 223.1 | 8.017 |
| Al-Baldiat | 103.4 | 95 | 130 | 11.66 | 125 | 116.67 | 12.2 | 98 | 97.2 | 200.3 | 7.199 |
| Al-Kadhimiya | 110 | 91.5 | 140 | 27.17 | 110 | 116.67 | 2.6 | 69 | 84.1 | 219.5 | 7.89 |
| Al-Karama | 98 | 157.5 | 590 | 23.76 | 90.5 | 90 | 9.3 | 82 | 75.3 | 289.5 | 10.4 |
| Al-Wathba | 280 | 105 | 590 | 33 | 155 | 130 | 8.3 | 82 | 75.6 | 323.2 | 11.61 |
| Al-Qadisya | 250.3 | 147 | 450 | 27.63 | 115 | 110 | 8.5 | 96 | 89.4 | 293.6 | 10.55 |
| Al-Dora | 192.4 | 132.5 | 530 | 27.1 | 125 | 103.3 | 7.5 | 78 | 92.6 | 290.3 | 10.43 |
| Al-Wahda | 183.4 | 104 | 330 | 32.77 | 135 | 126.67 | 1.3 | 98 | 90.3 | 267.1 | 9.601 |
| Al-Rasheed | 244.7 | 110 | 741 | 32.9 | 135 | 126.6 | 11.3 | 95 | 85.6 | 348.9 | 12.538 |
| Wi | 3.33 | 5 | 0.198 | 6.613 | 9.92 | 0.661 | 1.984 | 0.1 | 0.02 | ∑Wi = 27.826 | |
| Total HPI value = 105.542 | |||||||||||
| Table 5: | Calculate HPI-WQI of WTPs during winter (December, January, February, 2019) | |||
| Qi | |||||||||||
| WTPs | Fe (ppm) | Al (ppm) | Pb (ppm) | Zn (ppm) | Ni (ppm) | Cd (ppm) | F (ppm) | Mn (ppm) | Cu (ppm) | SUM WIQI |
HPI-WQI value |
| Al-Karkh | 67 | 46.5 | 190 | 12.8 | 55 | 103.4 | 6.6 | 41 | 46.3 | 213.3 | 7.667 |
| Sharq Dijla | 72 | 41 | 530 | 25.1 | 95 | 86.67 | 9 | 35 | 73.1 | 273.6 | 9.834 |
| Al-Sader | 85.7 | 44 | 150 | 14.7 | 90 | 70 | 8 | 65 | 53 | 187.4 | 6.736 |
| Al-Baldiat | 67.34 | 34.5 | 170 | 9.37 | 7.5 | 90 | 8.5 | 39 | 41.1 | 191.7 | 6.89 |
| Al-Kadhimiya | 45.7 | 46 | 180 | 5.13 | 9.5 | 80 | 9.2 | 38 | 39.1 | 195.6 | 7.031 |
| Al-Karama | 131.4 | 90 | 450 | 27.8 | 120 | 93.3 | 12 | 71 | 80.3 | 266.3 | 9.572 |
| Al-Wathba | 190.4 | 105.5 | 620 | 31.1 | 130 | 110 | 13 | 99 | 72.2 | 313.2 | 11.25 |
| Al-Qadisya | 84 | 49 | 550 | 22.84 | 90 | 96.67 | 62 | 95 | 82.5 | 285.1 | 10.24 |
| Al-Dora | 139.7 | 68 | 580 | 26.84 | 125 | 106.7 | 11 | 73 | 87.1 | 301.3 | 10.83 |
| Al-Wahda | 117.7 | 36 | 290 | 20.4 | 110 | 96.7 | 11 | 53 | 61.9 | 234.7 | 8.436 |
| Al-Rasheed | 239 | 65 | 910 | 29.94 | 105 | 106.7 | 15 | 86 | 25.2 | 365.5 | 13.14 |
| Wi | 3.33 | 5 | 0.198 | 6.613 | 9.92 | 0.661 | 1.984 | 0.1 | 0.02 | ∑Wi = 27.826 | |
| Total HPI value = 101.626 | |||||||||||
| Table 6: | Calculate HPI-WQI of WTPs during spring (March, April, May, 2019) | |||
| Qi | |||||||||||
| WTPs | Fe (ppm) | Al (ppm) | Pb (ppm) | Zn (ppm) | Ni (ppm) | Cd (ppm) | F (ppm) | Mn (ppm) | Cu (ppm) | SUM WIQI |
HPI-WQI value |
| Al-Karkh | 177.7 | 99 | 180 | 23.36 | 61 | 83.34 | 11.6 | 19 | 41.1 | 199.5 | 7.172 |
| Sharq Dijla | 33.67 | 76 | 210 | 7.43 | 59.5 | 70 | 13.5 | 58.5 | 11.4 | 196.1 | 7.048 |
| Al-Sader | 35.67 | 46 | 160 | 11.7 | 81 | 70 | 8.4 | 81 | 42.4 | 188.4 | 6.772 |
| Al-Baldiat | 31 | 40.5 | 150 | 16.9 | 71.5 | 93.34 | 9.1 | 64.4 | 30.2 | 193.7 | 6.963 |
| Al-Kadhimiya | 29.67 | 49.5 | 180 | 10.36 | 78.5 | 73.34 | 8.9 | 49.1 | 28.5 | 200.5 | 7.207 |
| Al-Karama | 108 | 92.5 | 170 | 27.1 | 72.5 | 80 | 9.3 | 89 | 61.1 | 223.4 | 8.031 |
| Al-Wathba | 175 | 137 | 580 | 25.53 | 102.5 | 116.7 | 8.2 | 97 | 97.2 | 307.8 | 11.06 |
| Al-Qadisya | 38.33 | 39.5 | 150 | 17.86 | 68.5 | 73.33 | 11.5 | 84.7 | 31.1 | 227.5 | 8.177 |
| Al-Dora | 171 | 55 | 450 | 25.13 | 85.5 | 73.33 | 10.9 | 81.6 | 67.8 | 249.7 | 8.975 |
| Al-Wahda | 66 | 95 | 190 | 7.03 | 62.5 | 76.67 | 11 | 96.2 | 51.3 | 198.1 | 7.122 |
| Al-Rasheed | 245.7 | 96 | 820 | 31.6 | 127.5 | 130 | 31.2 | 113 | 85.9 | 366.4 | 13.17 |
| Wi | 3.33 | 5 | 0.198 | 6.613 | 9.92 | 0.661 | 1.984 | 0.1 | 0.02 | ∑Wi = 27.826 | |
| Total HPI value = 91.697 | |||||||||||
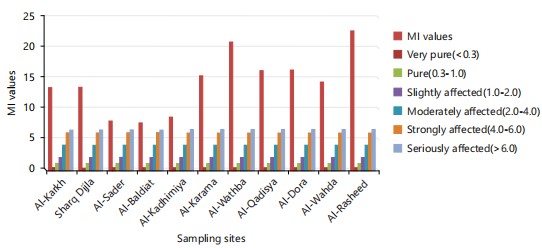
Metal index (MI): Table 8, 9 summarizes the classification and experimental findings of the 11WTP model for low-quality water with MI value of 155.93, indicating that the 11WTPs are seriously impaired by metal contamination, this was in accordance with a survey performed by 17-20. From the results of this analysis for 11WTPs, it was observed that the MI values for all the samples under review were >1 suggesting that there is a possible health risk for those consuming drinking water in the City of Baghdad, especially in the last five stations (Al-Wathba, Al-Qadisya, Al-Dora, Al-Wahda and Al-Rasheed), as can be seen in Fig. 3. Due to the broad flow of waste from medical Baghdad District, chemical and mineral processing plants, plant oil factories, textile mills and Rostamia sewage stations, which are located in this study area, a major change occurred at these stations during the study time22-26.
|
| Table 7: | Calculate HPI-WQI of WTPs during summer (June, July, August, 2019) | |||
| Qi | |||||||||||
| WTPs | Fe (ppm) | Al (ppm) | Pb (ppm) | Zn (ppm) | Ni (ppm) | Cd (ppm) | F (ppm) | Mn (ppm) | Cu (ppm) | SUM WIQI |
HPI-WQI value |
| Al-Karkh | 167 | 97.5 | 381 | 19.76 | 168.5 | 116.67 | 18.5 | 112 | 99.5 | 274.2 | 9.856 |
| Sharq Dijla | 109.3 | 85 | 331 | 22.43 | 135 | 130.67 | 15.5 | 139 | 95.7 | 270.1 | 9.708 |
| Al-Sader | 133.7 | 58.5 | 305 | 17.87 | 109.5 | 116.66 | 11 | 105 | 57.2 | 252.2 | 9.065 |
| Al-Baldiat | 77 | 74.5 | 243 | 11.43 | 115.5 | 103.4 | 12 | 112 | 42.9 | 235.1 | 8.45 |
| Al-Kadhimiya | 117.6 | 79 | 235 | 10.43 | 119 | 110 | 13 | 109 | 58.7 | 231.6 | 8.324 |
| Al-Karama | 158.3 | 131.5 | 495 | 23.23 | 174.5 | 130 | 17 | 122 | 92.4 | 306.6 | 11.02 |
| Al-Wathba | 185.6 | 136.5 | 624 | 28.37 | 206 | 159.6 | 19.2 | 153 | 102.1 | 355.7 | 12.785 |
| Al-Qadisya | 145.7 | 106.5 | 517 | 24.4 | 142.5 | 127 | 17.3 | 166 | 122.7 | 316.3 | 11.367 |
| Al-Dora | 129.6 | 78.5 | 593 | 31.87 | 175 | 139 | 19.6 | 121 | 97.5 | 331.2 | 11.905 |
| Al-Wahda | 125 | 84 | 405 | 19.9 | 184.5 | 123.4 | 17 | 126 | 98.2 | 284.6 | 10.23 |
| Al-Rasheed | 265 | 161.5 | 792 | 31.83 | 210 | 162.33 | 19.8 | 194 | 109.3 | 382.8 | 13.759 |
| Wi | 3.33 | 5 | 0.198 | 6.613 | 9.92 | 0.661 | 1.984 | 0.1 | 0.02 | ∑Wi = 27.826 | |
| Total HPI value = 116.112 | |||||||||||
| Table 8: | Mean MI-WQI of WTPs during four seasons | |||
| Heavy metals (ppm) | Mean concentrations (Ci) | Highest permitted value (MAC)i* | MI |
| Fe | 0.9816 | 0.3 | 3.272 |
| Al | 0.2845 | 0.2 | 1.422 |
| Pb | 0.0418 | 0.01 | 4.18 |
| Zn | 0.6709 | 3 | 0.224 |
| Ni | 0.0297 | 0.02 | 1.487 |
| Cd | 0.0039 | 0.003 | 1.3 |
| F | 0.2509 | 1 | 0.2509 |
| Mn | 0.1325 | 0.1 | 1.325 |
| Cu | 0.8209 | 1 | 0.8209 |
| ∑ MI = 14.602 | |||
| *Iraqi criteria and standards of water’s chemical limits and ICS: 13.060.20 number 417/2011 | |||
| Table 9: | MI-WQI recorded at different sampling WTPs | |||
| MI | |||||||||||||
| ID | WTPs | Fe (ppm) | Al (ppm) | Pb (ppm) | Zn (ppm) | Ni (ppm) | Cd (ppm) | F (ppm) | Mn (ppm) | Cu (ppm) | ∑MI-WQI value | MI-WQI scale | Water quality rating |
| 1 | Al-Karkh | 3.213 | 1.56 | 3.7 | 0.219 | 1.37 | 1.3 | 0.229 | 1.14 | 0.708 | 13.43 | >6.0 | Seriously affected |
| 2 | Sharq Dijla | 2.05 | 1.525 | 4.53 | 0.207 | 1.59 | 1.3 | 0.225 | 1.26 | 0.814 | 13.5 | >6.0 | Seriously affected |
| 3 | Al-Sader | 1.28 | 0.59 | 2.5 | 0.171 | 1.075 | 1.033 | 0.192 | 0.57 | 0.529 | 7.94 | >6.0 | Seriously affected |
| 4 | Al-Baldiat | 1.396 | 0.645 | 1.73 | 0.123 | 1.165 | 1.13 | 0.194 | 0.73 | 0.528 | 7.64 | >6.0 | Seriously affected |
| 5 | Al-Kadhimiya | 1.423 | 0.665 | 2.83 | 0.132 | 1.09 | 1.1 | 0.206 | 0.65 | 0.526 | 8.62 | >6.0 | Seriously affected |
| 6 | Al-Karama | 3.77 | 1.95 | 4.2 | 0.186 | 1.49 | 1.366 | 0.221 | 1.28 | 0.903 | 15.36 | >6.0 | Seriously affected |
| 7 | Al-Wathba | 5.826 | 2.215 | 5.85 | 0.294 | 1.82 | 1.57 | 0.319 | 1.94 | 1.067 | 20.9 | >6.0 | Seriously affected |
| 8 | Al-Qadisya | 4.329 | 1.085 | 4.96 | 0.231 | 1.625 | 1.4 | 0.274 | 1.46 | 0.884 | 16.24 | >6.0 | Seriously affected |
| 9 | Al-Dora | 4.413 | 1.63 | 5.21 | 0.297 | 0.168 | 1.47 | 0.291 | 1.85 | 0.962 | 16.31 | >6.0 | Seriously affected |
| 10 | Al-Wahda | 3.216 | 1.425 | 4.13 | 0.272 | 1.53 | 1.3 | 0.228 | 1.36 | 0.824 | 14.28 | >6.0 | Seriously affected |
| 11 | Al-Rasheed | 6.07 | 2.36 | 6.41 | 0.325 | 1.925 | 1.64 | 0.381 | 2.34 | 1.285 | 22.73 | >6.0 | Seriously affected |
| Total MI value = 155.93 | |||||||||||||
|
CONCLUSION
The results of HPI and MI models revealed that all WTP drinking water samples are unsuitable for human consumption as per the total MI value (155.93) and the annual mean HPI value (103.744), respectively. Due to their high concentrations in drinking water, people are most exposed to Fe, Pb, Al, Ni and Cd among all the prominent heavy metals examined in this study, while they are least exposed to Zn, F, Cu and Mn. In addition, the proposed MI and HPI models can provide accurate and reliable information on quality of drinking water and will serve as a useful tool for future sustainable management of WTPs.
SIGNIFICANCE STATEMENT
Public health is at risk in drinking water due to toxic substances which may have adverse health effects on humans. Consequently, maintaining the health of drinking water is a rising concern in Iraq. Estimate levels of heavy metals in the drinking water of Baghdad City, Iraq need to be studied. Heavy metal concentrations were measured using an atomic absorption spectrometer and contrasted with permissible limits established by Iraqi Guidelines and Water Chemical Limits Requirements. Heavy metal concentrations were used to measure health risk assessments using the HPI and MI models. The MI results have been used to achieve the heavy metal toxicity among the sampling stations. Furthermore, no work was done on HPI and MI models in Baghdad City related to 11WTPs.
REFERENCES
- Adewoyin, O.O., O.T. Kayode, O. Omeje and O.A. Odetunmibi, 2019. Risk assessment of heavy metal and trace elements contamination in groundwater in some parts of Ogun State. Cogent Eng., 6.
- Al-Hussaini, S.N.H., A.H.M.J. Al-Obaidy and A.A.M. Al-Mashhady, 2018. Environmental assessment of heavy metal pollution of Diyala River within Baghdad City. Appl. Water Sci., 8.
- Al-Mayah, W.T., 2021. Chemical and microbial health risk assessment of drinking water treatment plants in Kut City, Iraq. Mater. Today: Proceed., 42: 3062-3067.
- Al-Mayah, W.T., A.O. Shawardi and R.M. Salman, 2023. Microbiological quality assessment of drinking water at Al-Hayy City, Southern Iraq. J. Wasit Sci. Med., 10: 20-38.
- Al-Dulaimi, G.A. and M.K. Younes, 2017. Assessment of potable water quality in Baghdad City, Iraq. Air Soil Water Res., 10.
- Al-Mayah, W.T., S.O.M. Al-Mayyahi and S.H. Al-Shammary, 2021. Water quality assessment in terms of water quality index (WQI): A case study of the Tigris River, Baghdad, Iraq. IOP Conf. Ser.: Earth Environ. Sci., 779.
- Alobaidy, A.H.M.J., B.K. Maulood and A.J. Kadhem, 2010. Evaluating raw and treated water quality of Tigris River within Baghdad by index analysis. J. Water Resour. Prot., 2: 629-635.
- Alver, A., 2019. Evaluation of conventional drinking water treatment plant efficiency according to water quality index and health risk assessment. Environ. Sci. Pollut. Res., 26: 27225-27238.
- Bridgewater, L., APHA, AWWA and WEF, 2012. Standard Methods for the Examination of Water and Wastewater. 22nd Edn., American Public Health Association, ISBN: 9780875530130 Pages: 724.
- Caeiro, S., M.H. Costa, T.B. Ramos, F. Fernandes and N. Silveira et al., 2005. Assessing heavy metal contamination in Sado Estuary sediment: An index analysis approach. Ecol. Indic., 5: 151-169.
- Issa, H.M. and A.H. Alshatteri, 2021. Impacts of wastewater discharge from Kalar City on Diyala-Sirwan river water quality, Iraq: Pollution evaluation, health risks of heavy metals contamination. Appl. Water Sci., 11.
- Dede, O.T., I.T. Telci and M.M. Aral, 2013. The use of water quality index models for the evaluation of surface water quality: A case study for Kirmir Basin, Ankara, Turkey. Water Qual. Exposure Health, 5: 41-56.
- Eisler, R., 2000. Handbook of Chemical Risk Assessment: Health Hazards to Human, Plants, Animals. 1st Edn., CRC Press, Boca Raton, Florida, ISBN: 9780367801397, Pages: 4141.
- Eldaw, E., T. Huang, B. Elubid, A.K. Mahamed and Y. Mahama, 2020. A novel approach for indexing heavy metals pollution to assess groundwater quality for drinking purposes. Int. J. Environ. Res. Public Health, 17.
- Mensoor, M. and A. Said, 2018. Determination of heavy metals in freshwater fishes of the Tigris River in Baghdad. Fishes, 3.
- Fallahzadeh, R.A., M.T. Ghaneian, M. Miri and M.M. Dashti, 2017. Spatial analysis and health risk assessment of heavy metals concentration in drinking water resources. Environ. Sci. Pollut. Res., 24: 24790-24802.
- Kavcar, P., A. Sofuoglu and S.C. Sofuoglu, 2009. A health risk assessment for exposure to trace metals via drinking water ingestion pathway. Int. J. Hyg. Environ. Health, 212: 216-227.
- Liu, Y. and R. Ma, 2020. Human health risk assessment of heavy metals in groundwater in the Luan River catchment within the North China plain. Geofluids, 2020.
- Gokalp, Z. and D. Mohammed, 2019. Assessment of heavy metal pollution in Heshkaro stream of Duhok City, Iraq. J. Cleaner Prod., 237.
- Mohan, S.V., P. Nithila and S.J. Reddy, 1996. Estimation of heavy metals in drinking water and development of heavy metal pollution index. J. Environ. Sci. Health Part A: Environ. Sci. Eng. Toxicol., 31: 283-289.
- Prasad, B. and J. Bose, 2001. Evaluation of the heavy metal pollution index for surface and spring water near a limestone mining area of the lower Himalayas. Environ. Geol., 41: 183-188.
- Singh, R., A.S. Venkatesh, T.H. Syed, A.G.S. Reddy, M. Kumar and R.M. Kurakalva, 2017. Assessment of potentially toxic trace elements contamination in groundwater resources of the coal mining area of the Korba Coalfield, Central India. Environ. Earth Sci., 76.
- Stoiber, T., A. Temkin, D. Andrews, C. Campbell and O.V. Naidenko, 2019. Applying a cumulative risk framework to drinking water assessment: A commentary. Environ. Health, 18.
- Villanueva, C.M., M. Kogevinas, S. Cordier, M.R. Templeton and R. Vermeulen et al., 2014. Assessing exposure and health consequences of chemicals in drinking water: Current state of knowledge and research needs. Environ. Health Perspect., 122: 213-221.
- Wei, X., B. Gao, P. Wang, H. Zhou and J. Lu, 2015. Pollution characteristics and health risk assessment of heavy metals in street dusts from different functional areas in Beijing, China. Ecotoxicol. Environ. Saf., 112: 186-192.
- WHO, 2017. Guidelines for Drinking-Water Quality, 4th Edition, Incorporating the 1st Addendum. 4th Edn., World Health Organization, Geneva, Switzerland, ISBN: 978-92-4-154995-0, Pages: 631.
How to Cite this paper?
APA-7 Style
Al-Mayah,
W.T., Al-Ghasham,
N.A. (2024). Ecological and Health Risks Assessment of Levels of Heavy Metals in Drinking Water of Baghdad City, Iraq. Asian Journal of Biological Sciences, 17(4), 558-566. https://doi.org/10.3923/ajbs.2024.558.566
ACS Style
Al-Mayah,
W.T.; Al-Ghasham,
N.A. Ecological and Health Risks Assessment of Levels of Heavy Metals in Drinking Water of Baghdad City, Iraq. Asian J. Biol. Sci 2024, 17, 558-566. https://doi.org/10.3923/ajbs.2024.558.566
AMA Style
Al-Mayah
WT, Al-Ghasham
NA. Ecological and Health Risks Assessment of Levels of Heavy Metals in Drinking Water of Baghdad City, Iraq. Asian Journal of Biological Sciences. 2024; 17(4): 558-566. https://doi.org/10.3923/ajbs.2024.558.566
Chicago/Turabian Style
Al-Mayah, Wisam, Thamer, and Najah Alwan Owayez Al-Ghasham.
2024. "Ecological and Health Risks Assessment of Levels of Heavy Metals in Drinking Water of Baghdad City, Iraq" Asian Journal of Biological Sciences 17, no. 4: 558-566. https://doi.org/10.3923/ajbs.2024.558.566

This work is licensed under a Creative Commons Attribution 4.0 International License.