Health and Toxicity Effects of Solanum torvum and Solanum nigrum Berries Extract on Rats
-
Jemima Owusuah Asante

Department of Food Science and Technology, Kwame Nkrumah University of Science and Technology, Kumasi, Ghana
Christopher LarbieDepartment of Biochemistry and Biotechnology, Kwame Nkrumah University of Science and Technology, Kumasi, Ghana
Paul Poku Sampene OsseiDepartment of Pathology, Kwame Nkrumah University of Science and Technology, Kumasi, Ghana
Faustina Wireko-ManuDepartment of Food Science and Technology, Kwame Nkrumah University of Science and Technology, Kumasi, Ghana
Ibok Nsa OduroDepartment of Food Science and Technology, Kwame Nkrumah University of Science and Technology, Kumasi, Ghana
Ernest AggreyDepartment of Pharmaceutics, Faculty of Pharmacy and Pharmaceutical Sciences, Kwame Nkrumah University of Science and Technology, Kumasi, Ghana
Emmanuel Osei BrefoDepartment of Chemistry, Texas A and M University-Commerce, Texas, United States of America
| Received 25 Apr, 2024 |
Accepted 14 May, 2024 |
Published 31 Dec, 2024 |
Background and Objective: Solanum torvum (S. torvum) and Solanum nigrum (S. nigrum) are indigenous to various tropical and subtropical regions, such as Japan, Brazil, Mexico and Ghana, known locally as Kwahu nsusua and nsusua, respectively. This study aimed to explore the potential of anti-diabetic properties of freeze-dried boiled and raw berries of Solanum nigrum Linn. and Solanum torvum Swart using normoglycemic rats. Materials and Methods: Healthy male rats were divided into test and control groups, totalling fourteen groups of four rats each. The safety and anti-diabetic effects of aqueous extracts from Solanum torvum and Solanum nigrum were assessed. Measurements were conducted in triplicate and data were analyzed using One-way ANOVA and Tukey’s multiple comparison test, with results expressed as Mean±SEM at a 95% confidence interval. Results: All extract doses resulted in decreased rat body weights, with significant decreases in glucose levels observed 7 hrs post-administration for all doses. Particularly, the 1000 mg/kg doses of STR and STB extracts exhibited effects comparable to Glibenclamide (10 mg/kg). While no significant differences were noted in organ weight analysis, reductions in white blood cell and platelet counts were observed in some Solanum nigrum groups. Moreover, alterations in lipid profiles and liver function indices were noted in certain treatment groups, with the 1000 mg/kg STR extract significantly reducing bilirubin levels. Conclusion: The findings suggest that freeze-dried boiled and raw berries of Solanum nigrum and Solanum torvum possess hypoglycaemic properties and exhibit nephroprotective and hepatoprotective effects. These observations were supported by microscopic examination of the liver and kidney of treated animals.
| Copyright © 2024 Asante et al. This is an open-access article distributed under the Creative Commons Attribution License, which permits unrestricted use, distribution, and reproduction in any medium, provided the original work is properly cited. |
INTRODUCTION
Diabetes mellitus (DM) remains a non-communicable disease (NCD) that contributes to the increasing disease and economic burden globally. The International Diabetes Federation (IDF) reckoned that about 537 million people globally had diabetes in 2021 and by 2030 and 2045, this could increase to 643 and 783 million people, respectively1. In addition, Ghana, located in West Africa Sub-Region, has experienced a notable impact from both infectious diseases and non-communicable diseases (NCDs), such as diabetes, with an increase in the prevalence of the latter2. More precisely, the number of Ghanaians diagnosed with diabetes is projected to increase twofold from 500,000 in 2010 to about one million by 20302.
The prevalence of diabetes has reached a concerning magnitude, with more than 500 million individuals worldwide already affected by this significant ailment1. Furthermore, a staggering 50% of adults, up to a total of 240 million individuals globally, are oblivious to the fact that they have diabetes. Nearly 90% of these individuals reside in poor and middle-income nations, including Ghana. While the worldwide population is projected to increase by 20% by 2045, the number of individuals with diabetes is expected to rise by 46% during the same timeframe.
The estimated prevalence of diabetes mellitus (DM) among adults in Ghana is 2% of the population. This incidence is higher in urban areas (6.19%) compared to rural regions (2.33%) and it is also higher in females than males across all age categories3.
Despite the objective of Sustainable Development Goal (SDG) Goal3, which aims to achieve a 33% decrease in premature death caused by non-communicable diseases (NCDs) by 2030. The future prospects are bleak, as recent estimates indicate that the global adult population with diabetes mellitus is projected to exceed 642 million by 2040. Diabetes is a chronic condition that typically necessitates lifetime care. Therefore, it significantly influences the whole economic perspective in terms of quality of life, social welfare, healthcare and decreased productivity among patients.
Diabetics usually present with hyperglycemia due to the body’s inability to use insulin to break down ingested food or defects in insulin secretion. In Diabetes, there is a failure in the normal regulation of macronutrients such as lipids and carbohydrates4. Glucagon and incretins as well as other agents, perform important functions in the balance of glucose which includes glucose production by the liver and insulin resistance5.
In Ghana, due to the readily availability and affordability of Herbal medicines, various herbal preparations are used by patients for managing diabetes mellitus. These preparations are consumed in various dosage forms, especially as decoctions. It has been reported that some of these herbal preparations increase insulin release from β-cells and exert insulin-like action, further study is required in this regard. In addition, herbal preparations could not only complement existing conventional treatments but also provide the basis for scientific research into potential cures for DM type 2. Presently, there is no available cure for DM in spite of the various classes of therapeutic agents that are accessible for its management6. Also, concerns regarding the safety, efficacy and affordability of allopathic drugs for DM management are making patients opt for unconventional medicine, including herbal products for the management of DM6.
Solanum nigrum L. and Solanum torvum Swart are widely distributed tropical plants used as haematinics and in the management of various diseases including diabetes. This study therefore assessed the anti-diabetic effect of freeze-dried boiled and raw S. nigrum and S. torvum Swart berries in normoglycaemic rats.
MATERIALS AND METHODS
Study area: This toxicity and oral glucose tolerance study was carried out at the Laboratory of Department of Biochemistry and Biotechnology, Kwame Nkrumah University of Science and Technology, Kumasi-Ghana. The biochemical and haematological parameters were determined at the Clinical and Analysis Laboratory, Kwame Nkrumah University of Science and Technology Kumasi-Ghana and Tamale Teaching Hospital Laboratory, Tamale-Ghana. The histological study was carried out at Department of Pathology, School of Medicine and Dentistry, Kwame Nkrumah University of Science and Technology Kumasi-Ghana from April, 2022 to November, 2023.
Kits and chemicals: Glucometers and strips used for the measurement of fasting blood glucose were purchased from a local pharmacy in Ghana. Glibenclamide (Diabenol, Thailand) tablets were equally obtained from the local pharmacy (Ghana).
Sample collection and preparation: The 5 kg each of the mature unripe fruits of S. torvum and S. nigrum were collected from the wild on the campus of Okuafopa Agribusiness Centre (7.26434°N, -2, 77016°W) in the Bono Region of Ghana. The plant materials were authenticated by the Department of Herbal Medicine. The voucher numbers for the leaves of S. nigrum and S. torvum were given as KNUST/HM1/2024/L003 and KNUST/HM1/2024/L002, respectively. The voucher numbers for the fruits of S. nigrum and S. torvum were given as KNUST/HM1/2024/F002 and KNUST/HM1/2024/F001, respectively.
The fruits were sorted, removed from the stalk and washed with distilled water.
The fruits were wiped and freeze-dried (Harvestright freeze dryer) for 20 hrs and pulverized (Kimatsu Spectra 750 W mill, India) for 2 min. The powdered samples were put in airtight containers and stored in a freezer at -20°C. Sterile water was used to dissolve the extract for experimentation7,8, part of the fruits were also boiled at 100 for 10 min and treated as boiled. The prepared samples were designated as S. torvum raw (STR), S. torvum boiled (STB), S. nigrum raw (SNR) and S. nigrum boiled (SNB). These were individually dispersed in water at the stated doses and administered to the animals with the aid of feeding needles connected to syringes.
Experimental animals and diet: Animal experiments were performed after due clearance from the KNUST animal ethics committee and conducted at the department’s animal house. Male Wistar rats weighing between 100-140 g were obtained from animal house of KNUST, Kumasi. Animals were maintained on standard pellet feed (Mash, Agricare, Kumasi, Ghana) and water ad libitum. The animals were identified with tail marks made with permanent markers. All animal studies were conducted in accordance with the guidelines of the Committee for the Purpose of Control and Supervision of Experiment on Animals (CPCSEA, New Delhi, India) and the guide for the care and use of laboratory animals9. All animals were humanely handled during the experiment according to the approved protocol.
Acute toxicity study: Normal healthy male rats were divided into drug-treated ‘test’ groups and vehicle-treated ‘control’ groups, totally making up fourteen groups of four rats each. The LD50 was accessed using the fixed-dose method10 at 5000 mg/kg b.wt. The animals were observed for 7 days for signs of toxicity which included paw-licking, stretching, sneezing, diarrhoea and death.
Experimental design: In the experiment, 56 rats (48 normoglycaemic surviving rats, 8 normal rats) divided into 14 groups of four rats each were used:
| Group I: | Normal control rats received sterile water | |
| Group II: | Normoglycaemic rats received STB (100 mg/kg b.wt.) | |
| Group III: | Normoglycaemic rats received STB (500 mg/kg b.wt.) | |
| Group IV: | Normoglycaemic rats received STB (1000 mg/kg b.wt.) | |
| Group V: | Normoglycaemic rats received STR (100 mg/kg b.wt.) | |
| Group VI: | Normoglycaemic rats received STR (500 mg/kg b.wt.) | |
| Group VII: | Normoglycaemic rats received STR (1000 mg/kg b.wt.) | |
| Group VIII: | Normoglycaemic rats received SNR (100 mg/kg b.wt.) | |
| Group IX: | Normoglycaemic rats received SNR (500 mg/kg b.wt.) | |
| Group X: | Normoglycaemic rats received SNR (1000 mg/kg b.wt.) | |
| Group XI: | Normoglycaemic rats received SNB (100 mg/kg b.wt.) | |
| Group XII: | Normoglycaemic rats received SNB (500 mg/kg b.wt.) | |
| Group XIII: | Normoglycaemic rats received SNB (1000 mg/kg b.wt.) | |
| Group XIV: | Normoglycaemic rats received glibenclamide (10 mg/kg b.wt.)11 |
Extracts and glibenclamide were given once daily using the aid of a feeding needle connected to a syringe for 28 days. Each of the rats in the control group was treated with sterile water. The rats were monitored daily for any signs of toxicity and body weights were recorded weekly. On the 28th day, animals were fasted overnight and sacrificed by cervical dislocation, blood samples were collected for biochemical and haematological assessment and all the organs were removed for gross pathological examinations and sections taken for microscopic assessment by a pathologist.
Oral glucose tolerance test: Glucose tolerance test was first performed in normal rats at the doses stated on day 14. Animals were fasted overnight and were fed with glucose (2 g/kg) 30 min before the oral administration of the extracts, vehicle and standard drug. Blood glucose concentrations were determined using OneTouch Select Plus Glucometer and test strips. Samples were collected from the tail vein at 0, 2, 4, 7 and 24 hrs post glucose administration.
Determination of biochemical and haematological parameters: The fasting blood glucose and body weights were measured on days 0, 14, 21 and 28. Following a treatment period of 28 days, the animals were euthanized following a period of fasting overnight. Swift incisions were made in the cervical areas of euthanized animals using sterile blades. Blood samples were then collected into serum separator tubes and subjected to centrifugation at a speed of 3000 rpm for 15 min. The sera were divided into Eppendorf tubes and kept at a temperature of 4°C until further analysis. Various biochemical markers, including aspartate transaminase (AST), alanine transaminase (ALT), creatine kinase-myoglobin binding (CK-MB), bilirubin (direct and indirect), total cholesterol, triglycerides, high-density lipoproteins (HDL) and low-density lipoproteins (LDL), were assessed. Serum creatinine, urea, potassium, sodium and chloride levels were also measured using the Flexor Chemistry Analyser (USA).
Part of the blood samples were also collected into EDTA tubes for biochemical analyses using the Sysmex Haematology Analyser (USA). Total blood count analyses were performed.
Effect of treatment on body weight and relative organ weight (ROW): The body weight of each animal was measured on days 0, 14, 21 and 28. The percent change in body weight was calculated using the formula12:
where, Weightn is weight on day 14, 21 and 28 while Weight0 is the weight on day 0.
Organs including the heart, lungs, liver, spleen and kidneys of the experimental animals were harvested, cleaned with buffered saline and weighed to obtain the absolute organ weight (AOW). The relative organ weights were calculated using the formula12:
Histological studies: The liver and kidneys, from experimental rats, were blotted free of mucus and blood and fixed in 10 % neutral buffered formalin for 9 hrs. After fixation, the tissues were dehydrated in 80% alcohol for 9 hrs then 90% alcohol for another 1 hr. The cleared tissues were put into dilute alcohol for 1 hr 30min and finally placed in xylene for 1 hr 30 min.
Grossing: Tissues were measured in cm and grossed at 4 mm thick. Representative portions were kept in labelled cassettes. Each sample taken was placed in 10% neutral buffered formalin for 24 hrs. Samples were finally taken out and embedded in paraffin wax for sectioning using a manual microtome (4 mm thick). The sectioned samples were then stained in Hematoxylin and Eosin (H&E) for glass slides13. Leica, Model DM-2000, Wetzlar, Germany was the microscope used.
Statistical analysis: All measurements were done in triplicates. Data was then analyzed by One-way Analysis of Variance (ANOVA), followed by Tukey’s multiple comparison test and expressed as Mean±SEM where appropriate. All data was expressed at a 95% confidence interval.
RESULTS
Phytochemical components of the berries of Solanum: Phytochemical analyses of the aqueous extracts of freeze-dried S. torvum and S. nigrum revealed the presence of flavonoids, tannins, saponins, phytosterols, rich in antioxidants and fatty acids (data under review for publication elsewhere).
Acute toxicity studies: Single dose administration of 5000 mg/kg body weight did not produce any sign of toxicity in the animals even up to 7 days post-administration. There was no paw-licking, stretching, hair loss, diarrhoea, or death. Thus, the LD50 can be estimated to be <5000 mg/kg.
Effect of treatment on percentage change in body weight: Table 1 shows the effect of treatment on the percentage change in body weight of the rats over four weeks. The rats were weighed from day 0 to day 28 at a seven-day interval. A varied effect was observed.
| Table 1: | Effect of treatment on percent change in body weight | |||
| Percent change in body weight (%) | |||||
| Treatment | D0 | D7 | D14 | D21 | D28 |
| Control | 0 | 20.45±1.46 | 33.29±2.75 | 48.44±5.94 | 60.64±3.68 |
| 100 mg SNR | 0 | 12.60±0.80a | 18.31±2.08a | 27.39±2.24 | 33.54±0.90 |
| 500 mg SNR | 0 | 7.51±1.65a | 6.92±0.63a | 14.08±1.25 | 19.87±1.99a |
| 1000 mg SNR | 0 | -3.37±0.34a | 1.46±0.24a | 3.69±0.48a | 6.83±0.77a |
| 100 mg STR | 0 | 9.09±0.40a | 8.17±1.13a | 18.95±1.12 | 18.50±1.06a |
| 500 mg STR | 0 | 3.18±1.34a | 6.42±1.10a | 13.13±0.39 | 16.93±1.18a |
| 1000 mg STR | 0 | 3.37±0.31a | -2.68±0.58a | -8.57±0.81a | 2.15±0.20a |
| 100 mg STB | 0 | 9.76±0.59a | 14.48±0.85 | 28.09±1.40 | 29.92±1.12a |
| 500 mg STB | 0 | -2.69±0.75a | 0.93±0.21 | 6.62±1.46 | 10.17±1.31a |
| 1000 mg STB | 0 | -2.37±0.65a | -2.73±0.61 | -1.18±0.54 | -0.46±0.09a |
| 100 mg SNB | 0 | 9.76±2.10a | 19.41±1.44 | 31.90±2.13 | 35.76±1.31 |
| 500 mg SNB | 0 | 2.01±0.53a | 3.08±0.75 | 7.00±1.80 | -3.05±1.52a |
| 1000 mg SNB | 0 | 1.45±0.62a | 4.93±0.21 | 8.12±1.73a | 4.48±0.73a |
| GLIB. | 0 | 19.74±1.54 | 27.80±1.86 | 35.24±1.31 | 48.87±4.79 |
| Values are expressed as Mean±SEM (n = 4). Statistical significance “a” at p<0.05 compared to control | |||||
|
| Table 2: | Effects of treatments on blood glucose level of normoglycemic rats | |||
| Blood glucose level (mmol/L) | |||||
| Treatment | D0 | D7 | D14 | D21 | D28 |
| Control | 12.63±0.01 | 11.48±0.03 | 10.53±0.13 | 9.40±0.02 | 8.35±0.10 |
| 100 mg SNR | 12.45±0.10 | 10.98±0.13 | 9.73±0.02 | 8.50±0.19 | 7.93±0.09 |
| 500 mg SNR | 12.58±0.03 | 10.03±0.09 | 9.10±0.08 | 8.08±0.03 | 6.23±0.02 |
| 000 mg SNR | 12.60±0.10 | 9.90±0.13 | 8.80±0.09 | 7.20±0.04 | 5.20±0.03a |
| 100 mg STR | 12.63±0.03 | 10.50±0.01 | 9.75±0.05 | 8.68±0.07 | 7.53±0.03 |
| 500 mg STR | 12.35±0.07 | 10.13±0.02 | 9.35±0.04 | 8.18±0.03 | 6.68±0.04 |
| 1000 mg STR | 12.23±0.01 | 9.80±0.06 | 8.75±0.02 | 7.35±0.05 | 5.13±0.14a |
| 100 mg STB | 13.20±0.03 | 12.53±0.01 | 11.45±0.10 | 9.23±0.11 | 7.65±0.03 |
| 500 mg STB | 12.38±0.10 | 10.68±0.03 | 8.75±0.02 | 7.55±0.13 | 5.23±0.11a |
| 1000 mg STB | 12.73±0.14 | 9.03±0.12 | 7.15±0.10 | 5.78±0.08 | 4.65±0.03a |
| 100 mg SNB | 13.60±0.10 | 11.78±0.11 | 10.18±0.12 | 8.60±0.03 | 6.50±0.06 |
| 500 mg SNB | 12.88±0.02 | 10.40±0.03 | 8.75±0.01 | 7.28±0.11 | 5.53±0.13 |
| 1000 mg SNB | 13.73±0.13 | 10.63±0.15 | 8.68±0.14 | 6.35±0.03 | 4.93±0.01a |
| GLIB. | 13.13±0.10 | 10.48±0.09 | 8.53±0.03 | 6.15±0.04 | 4.93±0.13a |
| Values are expressed as Mean±SEM (n = 4). Statistical significance “a” at p<0.05 compared to control | |||||
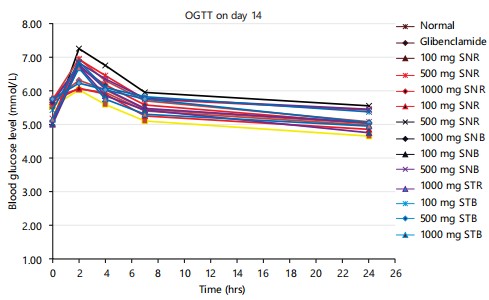
Effects of treatments on glucose tolerance on day 14: Figure 1 shows the effect of extracts on oral glucose tolerance in glucose-loaded rats. It was observed that the extracts (100, 500 and 1000 mg/kg) exhibited a significant (p<0.005) hypoglycaemic effect but glibenclamide (10 mg/kg) significantly depressed the peak of blood glucose level at 2 hrs after glucose loading. It was observed that STB, SNB, STR and SNR (500 and 1000 mg/kg) and glibenclamide treatment inhibited the rise in blood glucose levels in normoglycemic rats. The 1000 mg/kg dose showed an effect equivalent to that of glibenclamide (10 mg/kg). At the lowest dose of 100 mg/kg, all the extracts were unable to bring down the blood glucose level to control levels.
Effect of treatment on blood glucose levels of animals: Table 2 shows blood glucose concentrations measured on different days. The effect of different doses of the extracts on blood glucose levels together with the positive and negative control is presented in Table 2.
Effect of treatment of organ weight: Table 3 shows the effect of the various treatments on the relative weights of vital organs such as the kidney, heart, liver, spleen and lungs. When compared to the normal control, no significant differences were observed.
| Table 3: | Effect of treatment on relative organ weight | |||
| Relative organ weight (%) | |||||
| Treatment | Liver | Kidney | Heart | Lungs | Spleen |
| Control | 3.23±0.11 | 0.62±0.03 | 0.31±0.01 | 0.60±0.05 | 0.43±0.03 |
| 100 mg SNR | 2.89±0.23 | 0.58±0.02 | 0.31±0.01 | 0.69±0.04 | 0.29±0.02a |
| 500 mg SNR | 3.06±0.37 | 0.63±0.03 | 0.31±0.01 | 0.61±0.03 | 0.32±0.01 |
| 1000 mg SNR | 2.75±0.17 | 0.57±0.01 | 0.29±0.01 | 0.71±0.03 | 0.30±0.03 |
| 100 mg STR | 3.02±0.19 | 0.58±0.02 | 0.29±0.02 | 0.69±0.02 | 0.30±0.04 |
| 500 mg STR | 3.15±0.05 | 0.63±0.02 | 0.33±0.02 | 0.65±0.04 | 0.29±0.01a |
| 1000 mg STR | 3.33±0.27 | 0.86±0.09 | 0.37±0.02 | 0.74±0.45 | 0.30±0.02 |
| 100 mg STB | 3.07±0.08 | 0.59±0.03 | 0.38±0.07 | 0.67±0.09 | 0.29±0.01 |
| 500 mg STB | 3.11±0.15 | 0.61±0.04 | 0.32±0.01 | 0.71±0.06 | 0.27±0.02 |
| 1000 mg STB | 2.87±0.11 | 0.58±0.03 | 0.32±0.01 | 0.65±0.01 | 0.32±0.03 |
| 100 mg SNB | 3.24±0.09 | 0.58±0.01 | 0.31±0.01 | 0.57±0.03 | 0.30±0.01 |
| 500 mg SNB | 2.75±0.15a | 0.60±0.04 | 0.36±0.66 | 0.76±0.04 | 0.23±0.01 |
| 1000 mg SNB | 3.07±0.09 | 0.57±0.00 | 0.31±0.01 | 0.65±0.10 | 0.34±0.02 |
| GLIB. | 3.28±0.09 | 0.59±0.02 | 0.31±0.02 | 0.71±0.04 | 0.28±0.01 |
| Values are expressed as Mean±SEM (n = 4). Statistical significance “a” at p<0.05 compared to normal control | |||||
| Table 4: | Effects of treatments on haematology parameters | |||
| Parameter | Control | 100 mg SNR | 500 mg SNR | 1000 mg SNR | 100 mg STR | 500 mg STR | 1000 mg STR |
| WBC (x103/μL) | 12.60±1.55 | 8.78±0.79 | 11.50±1.94 | 11.30±1.28 | 11.38±0.59 | 10.15±0.86 | 12.63±2.40 |
| RBC (x106/μL) | 8.28±0.04 | 7.87±0.14 | 8.36±0.23 | 8.94±0.14 | 8.96±0.14 | 8.41±0.20 | 8.14±0.20 |
| HGB (g/dL) | 14.08±0.12 | 13.85±0.26 | 14.50±0.19 | 15.33±0.39 | 15.30±0.37 | 14.60±0.11 | 14.85±0.16 |
| HCT (%) | 54.48±0.36 | 52.88±0.86 | 56.60±0.92 | 59.78±1.24 | 59.80±0.72 | 56.93±0.72 | 56.25±0.06 |
| MCV (μm3) | 65.78±0.69 | 67.25±0.38 | 67.83±0.89 | 66.80±0.34 | 66.80±0.37 | 67.78±1.09 | 70.88±1.69 |
| MCH (pg/cell) | 17.00±0.21 | 17.60±0.13 | 17.38±0.38 | 17.15±0.19 | 17.08±0.23 | 17.40±0.51 | 18.55±0.40 |
| MCHC (g/dL) | 25.83±0.09 | 26.20±0.11 | 25.63±0.24 | 25.65±0.19 | 25.58±0.34 | 25.68±0.51 | 26.43±0.09 |
| PLT (x103/μL) | 942.50±97.85 | 845.00±65.53 | 909.75±45.32 | 887.00±94.07 | 987.50±89.15 | 1074.75±36.25 | 1074.50±67.68 |
| LYM (μm) | 6.88±0.56 | 4.18±0.47 | 5.60±0.44 | 5.53±0.86 | 5.93±0.52 | 5.73±0.50 | 3.80±0.29a |
| MXD | 1.78±0.30 | 1.48±0.26 | 1.30±0.17 | 1.15±0.17 | 1.40±0.20 | 1.40±0.11 | 1.06±0.31 |
| NEUT | 3.95±0.95 | 3.13±0.48 | 4.60±1.75 | 2.63±0.41 | 4.05±0.32 | 3.03±0.27 | 2.10±0.32 |
| 100 mg STB | 500 mg STB | 1000 mg STB | 100 mg SNB | 500 mg SNB | 1000 mg SNB | GLIB. | |
| WBC (x103/μL) | 11.00± 1.33 | 12.65± 2.26 | 9.93± 0.59 | 11.00± 0.84 | 8.85± 0.16 | 16.73± 0.68 | 12.98± 1.73 |
| RBC (x106/μL) | 8.65±0.13 | 8.75±0.24 | 8.66±0.17 | 8.07±0.27 | 7.87±0.33 | 8.70±0.10 | 8.16±0.22 |
| HGB (g/dL) | 15.08±0.22 | 14.93±0.43 | 14.73±0.31 | 14.33±0.30 | 14.13±0.75 | 14.43±0.13 | 14.20±0.23 |
| HCT (%) | 60.05±1.19 | 58.38±1.59 | 57.78±1.28 | 56.28±1.23 | 52.95±2.35 | 55.40±0.59 | 55.75±0.98 |
| MCV (μm3) | 69.48±0.38 | 66.78±1.22 | 66.75±0.53 | 69.83±1.21 | 66.60±0.86 | 64.48±0.81 | 68.38±0.81 |
| MCH (pg/cell | 17.48±0.20 | 17.08±0.47 | 17.03±0.37 | 17.78±0.30 | 18.20±0.31 | 16.88±0.24 | 17.43±0.27 |
| MCHC (g/dL) | 25.10±0.27 | 25.58±0.25 | 25.50±0.37 | 25.48±0.08 | 26.73±0.45 | 26.23±0.37 | 25.48±0.15 |
| PLT (x103/μL) | 700.00±33.24 | 982.75±129.76 | 1085.00±133.66 | 877.50±77.79 | 940.75±105 | 1137.00±249.52a | 1028.25±123.57a |
| LYM (μm) | 6.90±1.02 | 7.28±1.48 | 4.90±0.44a | 5.78±0.54 | 4.05±0.17a | 7.43±0.29 | 7.60±1.32 |
| MXD | 1.13±0.19 | 1.70±0.34 | 1.20±0.12 | 1.48±0.06 | 1.28±0.05 | 1.73±0.22 | 1.48±0.51 |
| NEUT | 2.98±0.62 | 3.68±0.63 | 3.83±0.39 | 3.75±0.42 | 3.65±0.06 | 5.83±1.02 | 3.90±0.33 |
| Values are expressed as Mean±SEM (n = 4). Statistical significance “a” at p<0.05 compared to normal control. WBC: White cell count, RBC: Red cell count, HGB: Hemoglobin, HCT: Hematocrit, MCV: Mean cell volume, MCH: Mean cell hemoglobin, MCHC: Mean cell hemoglobin concentration, PLT: Platelet count, LYM: Lymphocytes, MXD: Mixed cell percentage and NEUT: Neutrophil | |||||||
Effects on some haematological indices: Table 4 shows the effect of treatments on the complete blood count of experimental rats. A varied effect was seen in the white blood cell count and platelets but no significant change was observed in the red blood cell count and the concentration of haemoglobin.
Effect of treatment on some biochemical indices: Table 5 shows the effect of the extracts on the lipids profile in experimental. A varied effect on lipid parameters was observed.
The effect of treatments on the liver enzymes in experimental rats is illustrated in Table 6. A varied effect on liver function was observed.
|
Table 7 shows the effect of treatments on renal and heart function in experimental animals. A varied effect on kidney function was observed with regard to urea levels.
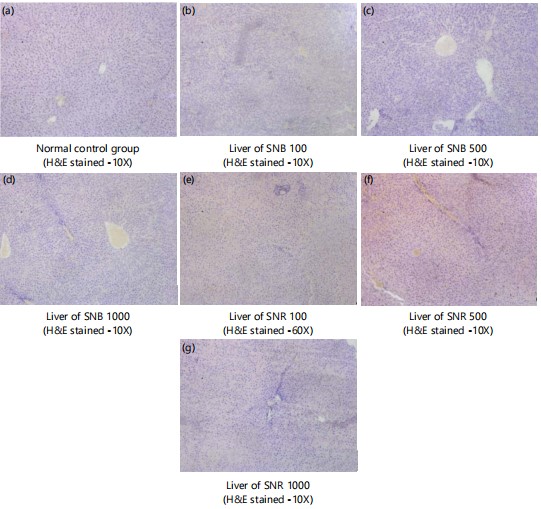
Microscopic examinations of liver: Figure 2(a-g) shows sections of the liver tissue of normal control and SNB and SNR (100, 500 and 1000 mg) treated groups (H&E stained-10X) composed primarily of normal hepatocytes with nuclei without atypia or pleomorphism. The hepatic triad, the centrolobular veins and sinusoids are without pathology.
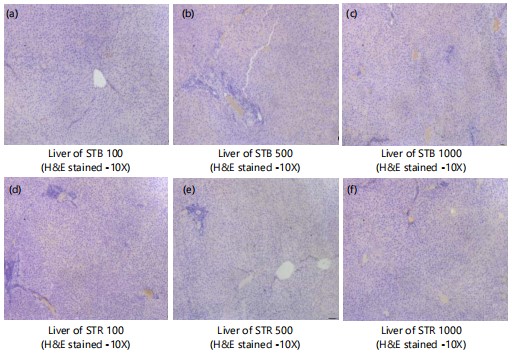
Figure 3(a-f) shows sections of the liver tissue of STB and STR (100, 500 and 1000 mg) treated groups (H&E stained-10X) composed primarily of normal hepatocytes with nuclei without atypia or pleomorphism. The hepatic triad, the centrolobular veins and sinusoids are without pathology.
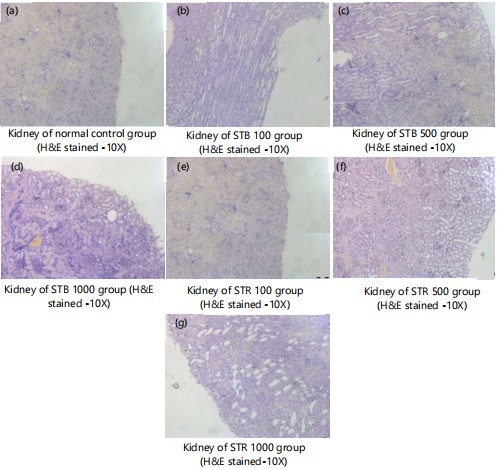
Microscopic examinations of kidney: Figure 4(a-g) shows kidney sections of normal control and STB and STR (100, 500 and 1000 mg) treated groups (H&E stained-10X) with normal kidney architecture, normal nephrons and glomeruli with its basement membranes intact. No evidence of pathological findings.
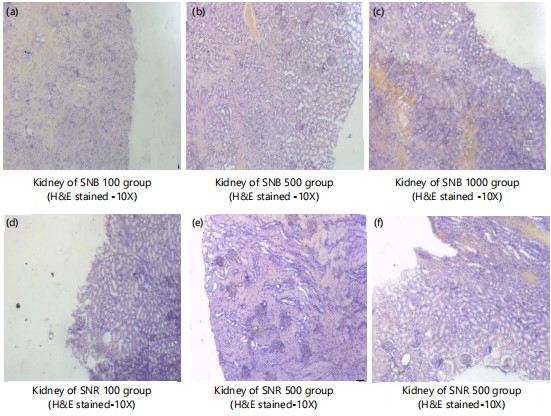
Figure 5(a-f) shows kidney of normal control and SNB and SNR (100, 500 and 1000 mg) treated groups (H&E stained-10X) showing normal kidney architecture with normal nephrons and glomeruli with its basement membranes intact. No evidence of pathological findings.
|
|
| Table 5: | Effects of treatments on lipids profile | |||
| Lipid profile of animals | |||||
| Treatment | TRIG (mmol/L) | HDL-C (mmol/L) | T-CHOL (mmol/L) | LDL-C (mmol/L) | VLDL-C (mmol/L) |
| Control | 0.78±0.04 | 0.42±0.05 | 0.35±0.03 | 1.56±0.11 | 1.30±0.01 |
| 100 mg SNR | 0.61±0.07 | 1.61±0.14 | 0.25±0.04 | 2.11±0.19 | 0.48±0.07 |
| 500 mg SNR | 0.73±0.09 | 1.59±0.10 | 2.27±0.23 | 0.33±0.07 | 0.37±0.04 |
| 1000 mg SNR | 0.81±0.03 | 1.47±0.19 | 2.01±0.22 | 0.32±0.07 | 0.53±0.10 |
| 100 mg STR | 0.82±0.06 | 1.44±0.19 | 1.73±0.07 | 0.24±0.09 | 0.35±0.04 |
| 500 mg STR | 0.79±0.03 | 1.30±0.04 | 1.80±0.05 | 0.31±0.09 | 0.45±0.15 |
| 1000 mg STR | 0.72±0.02 | 1.60±0.02 | 2.19±0.06 | 0.44±0.02 | 0.48±0.02 |
| 100 mg STB | 0.69±0.02 | 1.30±0.11 | 1.90±0.04 | 0.36±0.08 | 0.30±0.01 |
| 500 mg STB | 0.71±0.03 | 1.15±0.10 | 1.84±0.22 | 0.46±0.15 | 0.30±0.03 |
| 1000 mg STB | 0.74±0.04 | 1.17±0.27 | 2.05±0.17 | 0.41±0.08 | 0.28±0.06 |
| 100 mg SNB | 0.80±0.07 | 1.17±0.02 | 1.66±0.08 | 0.27±0.09 | 0.31±0.03 |
| 500 mg SNB | 1.06±0.08 | 1.26±0.03 | 1.89±0.09 | 0.22±0.01 | 0.49±0.03 |
| 1000 mg SNB | 1.16±0.18 | 1.31±0.06 | 2.17±0.14 | 0.37±0.03 | 0.45±0.03 |
| GLIB. | 0.62±0.15 | 1.23±0.07 | 1.71±0.11 | 0.45±0.03 | 0.53±0.16 |
| Values are expressed as Mean±SEM (n = 4). Statistical significance “a” at p<0.05 compared to control (One-way ANOVA followed by Duncan’s multiple comparison test), TRIG: Triglycerides, HDL-C: High density lipoprotein, T-CHOL: Total cholesterol, LDL-C: Low density lipoprotein and VLDL-C: Very low density lipoprotein | |||||
| Table 6: | Effects of treatments on liver function parameters | |||
| Liver function parameters | |||||
| Treatment | T.BIL (μmmol/L) | D.BIL (μmmol/L) | IND-BIL (μmmol/L) | ALT (U/L) | AST (U/L) |
| Control | 1.84±0.10 | 1.38±0.04 | 0.58±0.05 | 83.48±9.25 | 314.75±13.37 |
| 100 mg SNR | 1.74±0.03 | 1.34±0.12 | 0.55±0.09 | 78.55±2.38 | 283.00±3.77 |
| 500 mg SNR | 1.80±0.10 | 1.37±0.13 | 0.55±0.06 | 81.48±1.43 | 290.13±10.03 |
| 1000 mg SNR | 1.73±0.15 | 1.81±0.33 | 0.73±0.09 | 69.65±8.65 | 289.55±13.83 |
| 100 mg STR | 2.13±0.20 | 1.90±0.20 | 0.58±0.06 | 71.95±1.97 | 273.75±8.58 |
| 500 mg STR | 1.83±0.09 | 1.25±0.17 | 0.73±0.08 | 72.63±5.30 | 271.55±14.75 |
| 1000 mg STR | 1.71±0.03 | 1.29±0.22 | 0.21±0.04a | 61.83±1.49 | 288.08±2.95 |
| 100 mg STB | 1.71±0.01 | 1.19±0.09 | 0.60±0.07 | 77.88±5.37 | 261.53±7.24 |
| 500 mg STB | 2.20±0.31 | 2.14±0.39 | 0.68±0.06 | 66.58±13.73a | 290.63±10.97 |
| 1000 mg STB | 1.89±0.23 | 1.61±0.15 | 0.58±0.10 | 71.78±5.83 | 196.83±24.27a |
| 100 mg SNB | 2.68±0.31 | 2.57±0.51 | 0.48±0.14 | 50.43±4.66a | 285.93±9.27 |
| 500 mg SNB | 3.85±0.45 | 3.61±0.40 | 0.45±0.10 | 82.78±5.89 | 319.70±22.40 |
| 1000 mg SNB | 3.33±0.34 | 2.69±0.22 | 0.69±0.07 | 71.65±2.31 | 286.33±25.38 |
| GLIB. | 2.29±0.22 | 1.39±0.08 | 0.60±0.09 | 96.20±9.65 | 292.73±16.95 |
| Values are expressed as Mean±SEM (n = 4). Statistical significance “a” at p<0.05 compared to control (One-way ANOVA followed by Duncan’s multiple comparison test). T.BIL: Total bilirubin, D.BIL: Direct bilirubin, IND-BIL: Indirect bilirubin, ALT: Alanine aminotransferase and AST: Aspartate aminotransferase | |||||
| Table 7: | Effects of treatments on cardiorenal function | |||
| Cardiorenal function of animals | ||||||
| Urea | Creatinine | Potassium | Sodium | Chloride | CK-MB | |
| Treatment | (mmol/L) | (μmmol/L) | (mmol/L) | (mmol/L) | (mmol/L) | (IU/L) |
| Control | 12.13±0.11 | 60.20±1.35 | 7.30±0.21 | 140.58±0.57 | 102.60±0.39 | 31.80±2.16 |
| 100 mg SNR | 7.12±0.12a | 55.53±1.22 | 7.10±0.09 | 141.60±0.62 | 102.38±0.43 | 23.28±1.11a |
| 500 mg SNR | 7.30±0.15a | 47.43±9.96 | 7.05±0.07 | 142.10±0.40 | 102.25±0.47 | 22.53±1.06a |
| 1000 mg SNR | 8.15± 0.74a | 59.93± 3.71 | 7.15± 0.19 | 140.50±0.65 | 102.98±0.92 | 22.70±1.03a |
| 100 mg STR | 7.68±0.23a | 50.28±1.71 | 6.73±0.13 | 142.13±0.60 | 102.85±0.47 | 17.85±0.58a |
| 500 mg STR | 7.66±0.31a | 46.78±0.57 | 6.70±0.30 | 143.63±2.33 | 103.93±0.37 | 18.68±0.34a |
| 1000 mg STR | 7.75±0.35a | 46.25±3.15 | 6.60±0.30 | 141.55±0.75 | 104.00±1.2 | 16.55±0.75a |
| 100 mg STB | 7.81±0.52a | 53.93±3.40 | 6.73±0.30 | 142.30±1.06 | 102.10±1.11 | 29.86±3.28a |
| 500 mg STB | 9.36±1.15a | 63.28±3.90 | 7.83± 0.18 | 134.18±2.3a | 101.08±1.09 | 26.35±2.14a |
| 1000 mg STB | 8.84±0.73a | 46.83±7.88 | 7.15±0.34 | 137.30±2.67 | 105.13± 0.68 | 29.40±2.08a |
| 100 mg SNB | 6.88±0.27a | 62.34±4.34 | 7.45±0.19 | 142.33± 0.71 | 106.63± 0.58a | 43.15±2.12a |
| 500 mg SNB | 5.89±0.40a | 55.05±2.21 | 7.43±0.40 | 142.33±1.01 | 103.68±0.38 | 35.13±3.24a |
| 1000 mg SNB | 6.56±0.30a | 56.95± 3.45 | 6.40±0.30 | 144.05± 0.15 | 103.60±1.7 | 49.85±0.15a |
| GLIB. | 8.10± 0.09a | 56.40± 1.47 | 7.13±0.08 | 140.4±0.71 | 102.33± 0.57 | 31.13±1.07 |
| Values are expressed as Mean±SEM (n = 4). Statistical significance “a” at p<0.05 compared to control (CK-MB: Creatine Kinase-myocardial bond) | ||||||
|
DISCUSSION
Diabetes mellitus (DM) is a metabolic disorder associated with hyperglycaemia and hyperlipidaemia and associated with comorbidities such as obesity and hypertension. Orthodox medications are the first line of treatment for diabetes but due to undesirable effects and affordability challenges, some patients opt for unconventional treatments, including herbal products for the management of DM6. The present study was intended to examine the glucose-lowering effects of the extracts of Solanum torvum (ST) and Solanum nigrum (SN) berries. In the acute toxicity assessment, 5000 mg/kg of extracts of both plants were administered orally which showed the extract to be tolerable. This indicates the LD50 <5000 mg/kg orally. In the sub-chronic safety assessment, 100, 500 and 1000 mg/kg doses were selected based on safety data. In this study, normoglycemic rats were grouped and treated with freeze-dried boiled (STB and SNB) and freeze-dried raw (STR and SNR) extracts. A particular group of normal rats received sterile water and served as negative control whilst the positive control group of normoglycemic rats received glibenclamide (10 mg/kg) daily.
Table 1 shows the experimental data on the effect of treatment on the percentage change in body weight of the rats over four weeks. All extracts regardless of the dose resulted in a reduction in the body weight of the rats. However, a dose-dependent percentage change in body weight was observed. Also, the positive control (glibenclamide) group showed a significant change in body weight as compared to the normal group. The body weight of the normal control group increased significantly on days 14, 21 and 28 when compared to day 7. A similar trend was observed in extract-treated groups except groups that received 500 mg/kg and 1000 mg/kg SNB (Table 1). Similar results were reported by Satyanarayana et al.14 in their study on the antidiabetic effect of ethanolic extracts of S. torvum fruit in streptozotocin (STZ)-induced rats.
Glibenclamide (a sulphonylurea class of drug) acts by increasing the sensitivity and responsiveness of pancreatic beta cells so that more insulin can be produced to lower the amount of glucose in circulation15. From Fig. 1, it was observed that a 100 mg/kg dose of all extracts failed to reduce blood glucose levels after 120 min. The glucose inhibitory effect of 500 mg/kg extract was not significant as compared to 100 mg/kg after 120 min. It was however observed that all doses of extracts resulted in a significant decline in glucose levels 7 hrs after oral administration. The STR and STB extract at 1000 mg/kg showed an effect similar to that of glibenclamide (10 mg/kg). It could mean that the STB and STR extract at that dose possessed a similar mechanism to the standard drug (Glibenclamide). The antihyperglycemic activity of S. nigrum and S. torvum extracts may be due to the presence of several bioactive antidiabetic principles that increase the permeability of glucose into the cells by increasing the activity of glucose transporters to take up more glucose into the cells16.
Also as shown in Table 1, there were no significant changes in various haematological parameters such as haemoglobin (HB) and red blood cell (RBC) count. However, the extracts had varied effects on the white blood cell (WBC) and platelet count compared to the control group. Blood components in the normal control group were within the normal range. However, a significant (p<0.05) decrease in leukocyte (WBC) and platelet count was observed in 100 mg/kg SNR, 500 mg/kg SNB, 1000 mg/kg SNB and 1000 mg/kg STB groups compared to normal (Table 4). The no significant changes observed in RBC, haematocrit (HCT) and lymphocytes (LYM) indicated that the extracts at higher doses were not toxic and did not affect haematopoiesis or leukopoiesis. Furthermore, 500 mg/kg (STR, STB and SNB), 1000 mg/Kg (STR, STB and SNB) and GLIB group recorded high platelet levels as compared to the normal group.
The study next evaluated the effect of the various doses of extracts on the organs of normoglycemic rats. Table 3 shows the effect of the extracts on the relative weights of kidney, heart, liver, spleen and lungs. There were no significant differences observed in the relative weights of these organs, which indicated that the extract at any dose was non-toxic to these organs. This shows that the extracts did not interfere with liver function (Table 6) and cardiorenal function (Table 7). However, there was a significant change in the relative spleen weight. The decreased spleen sizes may be a result of the release of endogenous glucocorticoids that cause a decrease in spleen cellularity17. The increase in endogenous glucocorticoids affects insulin resistance which could account for the decrease in the inflammatory response seen in type 2 diabetic rats18.
The lipids profile of treatment groups was assessed. The results showed deranged levels of serum total cholesterol (T-Chol), triglycerides (TG), low-density lipoprotein–cholesterol (LDL-C) and very low-density lipoprotein-cholesterol (VLDL-C) for some groups when indexed against the normal. A non-significant change in high-density lipoprotein–cholesterol (HDL-C) was observed in all treated groups. Lipid abnormalities often termed dyslipidaemia is common in diabetes and are usually characterized by high T-Chol, high TG and low HDL-C19. The LDL-C levels may be moderately increased or normal as presented in Table 5.
The effect of the extracts on the liver enzymes in experimental rats is presented in Table 6. Deranged liver function indices were observed for serum alanine aminotransferase (ALT) and aspartate aminotransferase (AST) in the extract-treated group compared to the normal control group. The ALT levels have been established to decline with weight loss20. Also, whilst ALT is a specific marker for hepatic parenchymal injury, AST is a nonspecific marker for hepatic injury due to its presence in myocardial and skeletal muscle cells21. There were some significant changes in total bilirubin (T.BIL), direct bilirubin (D.BIL) and indirect bilirubin (IND-BIL). The rise in both total and direct bilirubin levels in normoglycemic rats in this investigation supported the findings of previous studies conducted by Omonkhua et al.22 and Elkhateeb et al.23. The observed reduction in bilirubin levels in the group treated with 1000 mg/kg of STR extract (Table 6) indicates that STR at such dosage has the ability to lower bilirubin levels. Treatment with Glibenclamide, showed no significant change in liver function indices when compared to normal rats. Overall, our data suggest the protective effect of the extracts against hepatotoxicity.
Table 7 shows the effect of the extracts on the cardiorenal function in experimental rats. Creatinine, potassium, sodium and chloride concentrations were non-significantly affected when juxtaposed against that of normal control. The results in Table 7 show that the extracts are neither cardiotoxic nor nephrotoxic. However, the significant change (p<0.05) observed regarding urea levels when compared to normal control could be a result of low protein content in the standard pellet feed provided for the rats. It is therefore suggested that the use of freeze-dried boiled and raw berries of Solanum nigrum (S. nigrum) and Solanum torvum (S. torvum) Swart as a hypoglycaemic agent also has nephroprotective and hepatoprotective effect to prevent nephropathy associated with diabetes. These observations were supported by the histopathological observations of the liver sections (Fig. 2(a-g), Fig. 3 (a-f) and kidney sections (Fig. 4 (a-g) and Fig. 5 (a-f)) of animals treated with the extracts are in keeping with normal liver and kidney architecture.
CONCLUSION
The findings of this investigation into the anti-diabetic effect of freeze-dried boiled and raw berries of S. nigrum and S. torvum Swart using normoglycemic rats can be concluded that all extracts regardless of the dose resulted in a reduction in body weight of the rats. The extracts at 1000 mg/kg showed an effect similar to that of glibenclamide (10 mg/kg) in reducing hyperglycaemia. In addition, there were no significant differences observed in the relative weights of the kidney, heart, liver and lung, which indicated that the extract at any dose was non-toxic to these organs. Furthermore, the lipids profile and liver function indices were deranged for some groups when indexed against the normal. However, the significant decrease in bilirubin levels in the 1000 mg/kg STR extract-treated group suggests the bilirubin-lowering effects. Also, the cardiorenal function indices were non-significant when juxtaposed against that of normal control which shows that the extracts are not cardionephrotoxic.
SIGNIFICANCE STATEMENT
In Ghana, Solanum nigrum L. and Solanum torvum Swart are widely used in the management of various disease conditions including diabetes mellitus. This study, therefore, assessed the anti-diabetic effect of freeze-dried boiled and raw Solanum nigrum and Solanum torvum Swart berries in normoglycaemic rats. The Solanum torvum raw and Solanum torvum boiled berry extract showed an effect similar to that of glibenclamide. Furthermore, histopathological observations of the liver and kidney sections of animals treated with the extracts were in keeping with normal liver and kidney architecture. It is therefore suggested that the use of freeze-dried boiled and raw berries of Solanum nigrum and Solanum torvum as a hypoglycaemic agent also has nephroprotective and hepatoprotective effects.
ACKNOWLEDGMENT
The authors are grateful to the staff of KNUST animal house, Department of Biotechnology and Biochemistry, Department of Pathology, Clinical Analysis Laboratory, KNUST and Tamale Teaching Hospital Laboratory for their contribution towards the success of this study.
REFERENCES
- Kumar, A., R. Gangwar, A.A. Zargar, R. Kumar and A. Sharma, 2024. Prevalence of diabetes in India: A review of IDF diabetes atlas 10th edition. Curr. Diabetes Rev., 20.
- Doherty, M.L., E. Owusu-Dabo, O.S. Kantanka, R.O. Brawer and J.D. Plumb, 2014. Type 2 diabetes in a rapidly urbanizing region of Ghana, West Africa: A qualitative study of dietary preferences, knowledge and practices. BMC Public Health, 14.
- Gatimu, S.M., B.W. Milimo and M.S. Sebastian, 2016. Prevalence and determinants of diabetes among older adults in Ghana. BMC Public Health, 16.
- Dilworth, L., A. Facey and F. Omoruyi, 2021. Diabetes mellitus and its metabolic complications: The role of adipose tissues. Int. J. Mol. Sci., 22.
- Mingrone, G. and L. Castagneto-Gissey, 2014. A central role of the gut in glucose homeostasis. Nat. Rev. Endocrinol., 10: 73-74.
- Adinortey, M.B., R. Agbeko, D. Boison, W. Ekloh and L.E. Kuatsienu et al., 2019. Phytomedicines used for diabetes mellitus in Ghana: A systematic search and review of preclinical and clinical evidence. Evidence-Based Complementary Altern. Med., 2019..
- Mohan, M., B.S. Jaiswal and S. Kasture, 2009. Effect of Solanum torvum on blood pressure and metabolic alterations in fructose hypertensive rats. J. Ethnopharmacol., 126: 86-89.
- Kusirisin, W., C. Jaikang, C. Chaiyasut and P. Narongchai, 2009. Effect of polyphenolic compounds from Solanum torvum on plasma lipid peroxidation, superoxide anion and cytochrome P450 2E1 in human liver microsomes. Med. Chem., 5: 583-588.
- NRC, 2011. Guide for the Care and Use of Laboratory Animals. 8th Edn., National Academies Press, Washington, DC, United State, ISBN-13: 9780309154000, Pages: 246.
- Erhirhie, E.O., C.P. Ihekwereme and E.E. Ilodigwe, 2018. Advances in acute toxicity testing: Strengths, weaknesses and regulatory acceptance. Interdiscip. Toxicol., 11: 5-12.
- Jagtap, A.G. and P.B. Patil, 2010. Antihyperglycemic activity and inhibition of advanced glycation end product formation by Cuminum cyminum in streptozotocin induced diabetic rats. Food Chem. Toxicol., 48: 2030-2036.
- Larbie, C., J. Oduro and J.J. Tofah, 2018. Aqueous ethanolic extract of Acalypha inferno accelerates the clearance of glucose in normoglycaemic rats. Pharma Innovation, 7: 79-83.
- Latha, R.C.R. and P. Daisy, 2011. Insulin-secretagogue, antihyperlipidemic and other protective effects of gallic acid isolated from Terminalia bellerica Roxb. in streptozotocin-induced diabetic rats. Chem. Biol. Interact., 189: 112-118.
- Satyanarayana, N., S.V. Chinni, R. Gobinath, P. Sunitha, A.U. Sankar and B.S. Muthuvenkatachalam, 2022. Antidiabetic activity of Solanum torvum fruit extract in streptozotocin-induced diabetic rats. Front. Nutr., 9.
- Li, Q., Z. Yang, B. Lu, J. Wen, Z. Ye and L. Chen et al., 2011. Serum uric acid level and its association with metabolic syndrome and carotid atherosclerosis in patients with type 2 diabetes. Cardiovasc. Diabetol., 10.
- Pandeya, K.B., I.P. Tripathi, M.K. Mishra, N. Dwivedi and Y. Pardhi et al., 2013. A critical review on traditional herbal drugs: An emerging alternative drug for diabetes. Int. J. Org. Chem., 3: 1-22.
- Guo, T.L. and K.L. White, 2010. Methods to Assess Immunotoxicity. In: Comprehensive Toxicology, McQueen, C.A. (Ed.), Elsevier, Amsterdam, Netherlands, ISBN: 9780080468846, pp: 567-590.
- Beaupere, C., A. Liboz, B. Fève, B. Blondeau and G. Guillemain, 2021. Molecular mechanisms of glucocorticoid-induced insulin resistance. Int. J. Mol. Sci., 22.
- Bhowmik, B., T. Siddiquee, A. Mujumder, F. Afsana and T. Ahmed et al., 2018. Serum lipid profile and its association with diabetes and prediabetes in a rural Bangladeshi population. Int. J. Environ. Res. Public Health, 15.
- Palmer, M. and F. Schaffner, 1990. Effect of weight reduction on hepatic abnormalities in overweight patients. Gastroenterology, 99: 1408-1413.
- Sepodes, B., R. Maio, R. Pinto, C. Marques and J. Mendes-do-Vale et al., 2004. Tempol, an intracelullar free radical scavenger, reduces liver injury in hepatic ischemia-reperfusion in the rat. Transplant. Proceed., 36: 849-853.
- Omonkhua, A.A., E.A. Adebayo, J.A. Saliu, T.H. Ogunwa and T.T. Adeyelu, 2014. Liver function of streptozotocin-induced diabetic rats orally administered aqueous root-bark extracts of Tetrapleura tetraptera (Taub). Niger. J. Basic Appl. Sci., 22: 99-106.
- Elkhateeb, A., I.E. Khishin, O. Megahed and F. Mazen, 2015. Effect of Nigella sativa Linn oil on tramadol-induced hepato- and nephrotoxicity in adult male albino rats. Toxicol. Rep., 2: 512-519.
How to Cite this paper?
APA-7 Style
Asante,
J.O., Larbie,
C., Ossei,
P.P., Wireko-Manu,
F., Oduro,
I.N., Aggrey,
E., Brefo,
E.O. (2024). Health and Toxicity Effects of Solanum torvum and Solanum nigrum Berries Extract on Rats. Asian Journal of Biological Sciences, 17(4), 482-495. https://doi.org/10.3923/ajbs.2024.482.495
ACS Style
Asante,
J.O.; Larbie,
C.; Ossei,
P.P.; Wireko-Manu,
F.; Oduro,
I.N.; Aggrey,
E.; Brefo,
E.O. Health and Toxicity Effects of Solanum torvum and Solanum nigrum Berries Extract on Rats. Asian J. Biol. Sci 2024, 17, 482-495. https://doi.org/10.3923/ajbs.2024.482.495
AMA Style
Asante
JO, Larbie
C, Ossei
PP, Wireko-Manu
F, Oduro
IN, Aggrey
E, Brefo
EO. Health and Toxicity Effects of Solanum torvum and Solanum nigrum Berries Extract on Rats. Asian Journal of Biological Sciences. 2024; 17(4): 482-495. https://doi.org/10.3923/ajbs.2024.482.495
Chicago/Turabian Style
Asante, Jemima, Owusuah, Christopher Larbie, Paul Poku Sampene Ossei, Faustina Wireko-Manu, Ibok Nsa Oduro, Ernest Aggrey, and Emmanuel Osei Brefo.
2024. "Health and Toxicity Effects of Solanum torvum and Solanum nigrum Berries Extract on Rats" Asian Journal of Biological Sciences 17, no. 4: 482-495. https://doi.org/10.3923/ajbs.2024.482.495

This work is licensed under a Creative Commons Attribution 4.0 International License.