Growth Performance of Clarias gariepinus Fingerlings Fed Fermented Canavalia ensiformis Seed Meals
-
Kesonga Garduga Michael


Department Of Fisheries, Modibbo Adama University, Yola P.M.B. 2076, Ilorin, Adamawa, Nigeria
O.A. SogbesanDepartment Of Fisheries, Modibbo Adama University, Yola P.M.B. 2076, Ilorin, Adamawa, Nigeria
L.U. OnyiaDepartment Of Fisheries, Modibbo Adama University, Yola P.M.B. 2076, Ilorin, Adamawa, Nigeria
| Received 15 Oct, 2022 |
Accepted 29 Jan, 2023 |
Published 31 Mar, 2023 |
Background and Objective: Fish farms’ output and profits have been facing a greater challenge with a hike in the price of feed ingredients hence, this study was designed to evaluate the growth performance of Clarias gariepinus fingerlings fed fermented Canavalia ensiformis seed meals. Materials and Methods: The proximate analysis of the diets was done using the Association of Official Analytical Chemists methods. Fermented Canavalia ensiformis meals were used to formulate five different 40.0% isoproteic experimental diets each at 0, 25, 50, 75 and 100% and coded FCe, which were fed at 5% body weight to fingerlings of Clarias gariepinusfingerlings. One hundred and fifty Clarias gariepinus (0.96 g±0.03 and 3.93 cm±0.28) were randomly assigned to five treatments of ten fingerlings, replicated three times in a Completely Randomised Design (CRD) in 35 L plastic circular tanks through a semi-flow-through system for 84 days. Weights and lengths were measured biweekly and used to calculate the growth and nutrient utilization parameters. Nutrients, digestibility, haematology and economic evaluation of the fish fed the diets were also determined. Data collected were analysed using a one-way analysis of variance. Results: There were significant differences (p<0.001) in the specific growth rate as the inclusion levels of the tested meals increased. The mean water quality parameters were within the tolerable limit for aquaculture. Nutrient digestibility and haematology were significantly (p<0.001) reduced in the treatment diets. Inclusion of the tested meals in the diets resulted in the reduction of feed cost kg–1, cost of feed intake/fish and feed cost/weight gain with increased inclusion levels. Conclusion: Clarias gariepinus fingerlings can feed on up to 25% inclusion-level fermented Canavalia ensiformis diet without adverse effects on the growth performance.
| Copyright © 2023 Michael et al. This is an open-access article distributed under the Creative Commons Attribution License, which permits unrestricted use, distribution, and reproduction in any medium, provided the original work is properly cited. |
INTRODUCTION
The recent increase in aquaculture development in Nigeria and the world at large is accompanied by the need to be incorporating plant materials in fish feed1, to dispense total reliance on conventional legumes that have successfully replaced fishmeal. Soybean that could replace not less than 50% of the fishmeal in the diet of fish species is not so much available in the market and commands a high price because of their competitive use as food by man and feed ingredients by other livestock feed producers2. There is, therefore, a need to shift priority to searching for alternative plant protein feed ingredients of little or no use and cheaper in terms of cost to replace these conventional legumes. The search for alternative feedstuff to the current conventional feed ingredients requires that the digestibility of the alternative feed ingredients be favourably compared to the conventional feed ingredients3.
Legumes have been recognized to be the second most valuable plant source for human and animal nutrition and the third largest family among flowering plants, consisting of approximately 650 genera and 20000 species4,5. Kalidass et al.6 reported that legume seeds are important sources of nutrients and can serve as high-quality dietary protein to meet the nutrient requirements of fishes7,8.
The wild legumes, which have tremendous potential for commercial exploitation but remain ignored, form a good scope in this context9. Inbasekar10 reported that common proteinaceous edible legumes (soybean, cowpea and others) are available in the market and in most cases, production rates are compared with consumption (as food and feed) has remained unmet and an ever-increasing demand has been witnessed by food and feed industries. Also, switching most of the world’s population to a protein-rich vegetarian-based diet from animal-based protein has created an unwarranted scarcity to plant protein resources. In this regard, legumes have been highlighted as an effective substitute for animal11.
Canavalia ensiformis is an annual or weak perennial legume with climbing or bushy growth forms. It is woody with a long taproot. The 8 in (20 cm) long and 4 in (10 cm) wide leaves have three egg-shaped leaflets that are wedge-shaped at the base and taper towards the tip. The 1 in (2.5 cm) long flowers are rose-coloured, purplish, or white with a red base. It has a 12 in (30 cm) long, 1.5 in (3.8 cm) wide, sword-shaped seed pod. Seeds are white, red, brown and smooth with a brown seed scar that is about one-third the length of the seed. Its roots have nodules which fix nitrogen12,13. The genus Canavalia comprising of 48 species of these underutilized legumes. They are widely distributed and indigenous to the tropics12, rarely eaten by man14 and their nutritional potential has been well studied in the monogastric and poultry industry15,16. Nutritional trial in fish includes the works of the some researchers12,17-20.
Alonso et al.21 define Anti-Nutritional Factors (ANFs) as innate components of a food/feed ingredient that have a limiting effect on the food/feed intake, digestion and nutrient absorption. Possibly the most limiting factor for the use of plant feed ingredients as nutrient sources for fish are ANFs inherent to them. Francis et al.22 reported that ANFs in legumes can be divided into several groups based on their chemical and physical properties such as non-protein amino acids, quinolizidine alkaloids, cyanogenic glycosides and pyrimidine glycosides, isoflavones, tannins, oligosaccharides, saponins, phytates, lectins or protease inhibition. Their elimination can be achieved either by a selection of plant genotypes with low levels of such factors or through post-harvest processing (germination, cooking, boiling, leaching/soaking, toasting and fermentation).
This study intends to use fermentation methods to eliminate the anti-nutrients in Canavalia ensiformis seed meals and its inclusion level effects on the growth of Clarias gariepinus.
MATERIALS AND METHODS
Study area: The research work commenced in January 2022. The feeding trial was conducted at the Fisheries Research Farm of the Department of Fisheries, Moddibo Adama University of Technology (MAUTECH), Yola. Adamawa State is located at latitude 9.14°N, longitude 12.38°E and an altitude of 185.9 m. Girei is located on latitude 9.22°N, longitude 12.33°E and altitude of 245 m. It has an average annual rainfall of about 759 mm with a maximum temperature of 39.7°C. The rainy season run from May through October, while the dry season commences in November and ends in April. The driest months of the year are January and February when the relative humidity drops to 13%23,24.
| Table 1: | Percentage compositions of ingredients with fermented Canavalia ensiformis meal | |||
Inclusion levels |
|||||
| Ingredients (g/100 g) | Control (0%) |
FCe (25%) |
Fce 50%) |
Fce (75%) |
Fce (100%) |
| Fishmeal (68%) | 32 |
32 |
32 |
32 |
32 |
| Glycine max meal (46%) | 33 |
24.75 |
16.5 |
8.26 |
0 |
| Fermented Canavalia ensiformis (34.7%) | 0 |
10.93 |
21.87 |
32.81 |
43.75 |
| Yellow maize (10) | 30 |
27.32 |
24.63 |
19.29 |
19.25 |
| Vitamin/mineral premix | 1 |
1 |
1 |
1 |
1 |
| Lysine | 0.5 |
0.5 |
0.5 |
0.5 |
0.5 |
| Methionine | 0.5 |
0.5 |
0.5 |
0.5 |
0.5 |
| Palm oil | 1 |
1 |
1 |
1 |
1 |
| Cassava starch | 1 |
1 |
1 |
1 |
1 |
| Dicalcium phosphate | 0.5 |
0.5 |
0.5 |
0.5 |
0.5 |
| Common salt | 0.5 |
0.5 |
0.5 |
0.5 |
0.5 |
| Total | 100 |
100 |
100 |
100 |
100 |
| Calculated crude protein | 39.94 |
39.67 |
39.4 |
38.87 |
38.87 |
| Gross energy (KJ/100 g) | 1868.6 |
1818.8 |
1769.7 |
1766.4 |
1732.9 |
| GE:CP | 46.78 |
45.84 |
44.91 |
45.13 |
44.58 |
| FCeM: Fermented Canavalia ensiformis meal, GE:CP: Gross energy:Crude protein, Calculated gross energy (KJ/100 g) = Protein×23.6 KJ/100 g+Lipid×39.5 KJ/100 g+NFE×17.2 KJ/100 g (Blaxter, 1989), Vitamin-mineral premix provides per kg the following: 12.000.000 IU Vitamin A, 2.000.000 IU Vitamin D3, 10 g Vitamin E, 2 g Vitamin K3, 1 g Vitamin B1, 5 g Vitamin B2, 1.5 g Vitamin B6, 10 g Vitamin B12, 30 g Nicotinic acid, 10 g Pantothenic acid, 1 g Folic acid, 50 g Biotin, 250 g Choline chloride 50%, 30 g Iron, 10 g copper, 50 g Zinc, 60 g Manganese, 1 g Iodine, 0.1 g Selenium and Cobalt 0.1 g | |||||
Canavalia ensiformis fruits were collected from Girei and their surroundings in Adamawa State. They were identified using a field handbook by Larese et al.25 a plant taxonomist at the Forestry and Wildlife Department of Modibbo Adama University of Technology, Yola (MAUTECH). Raw seeds were moistened with water, kept in a container with a cover to ferment for 72 hrs under laboratory conditions, oven-dried at 50°C then milled and tagged Fermented Seed Meal (FSM).
Determination of nutrient compositions: The seed meals were analyzed for nutrient compositions26.
Feed formulation: A basal diet of 40% crude protein was formulated from the commercial ingredients (fish meal, Glycine max meal, yellow maize, vitamin, minerals, palm oil, dicalcium phosphate and starch) and Glycine max was toasted. The dry ingredients were milled with a grinding machine to very fine particle size and sieved. The ingredients were weighed and mixed to homogeneity and pelleted with a pelleting machine with a 0.2 mm diameter size. The pellets were air-dried at room temperature and stored in a refrigerator until the commencement of the feeding. Fermented Canavalia ensiformis were included in the experimental diets to replace Glycine max meal as a plant protein source at inclusion levels of 0 (control), 25, 50, 75 and 100% as shown in Table 1.
Collection and acclimatization of experimental fish: One hundred and fifty fingerlings of Clarias gariepinus were obtained from Aqua Guide Farm in Federal Housing Estate, Girei LGA, Adamawa State, Nigeria and were used for the feeding trials. The fish were kept acclimatizing to the farm conditions and fed with the experimental diets for 12 weeks.
Experimental design: A completely randomized design was used, where one hundred and fifty fingerlings were randomly allocated to five experimental groups (ten fingerlings of Clarias gariepinus per bowl and replicated).
Data collections
Growth performance and nutrient utilization: The initial weight and length of fish in each treatment were taken at 2 weeks intervals. The feed rations fed were adjusted based on the new weight. The weight and length recorded were used to determine the growth performance of the fish and the feed supplied was also used to determine the nutrient utilization parameters following the methods of Udo and Umoren27.
Growth performance: At the end of 12 weeks, the growth rates, condition factor, survival rate and nutrient utilization were computed and analyzed.
Weight gain (g): The total and mean weight gains were calculated for each replicate and treatment as follows27:
Where:
Wf |
= |
Final weight of fish at the end of the experiment |
WI |
= |
Initial weight of fish at the beginning of the experiment |
n |
= |
Number of weeks |
Relative Growth Rate (RGR): This is the percentage ratio of the weight gain to the initial body weight and was determined as follows:
Specific Growth Rate (SGR %/day): This is the percentage of daily weight gain and was computed according to the formula below:
Where:
Log Wf |
= |
Logarithm of the fish final weight |
Log WI |
= |
Logarithm of the fish’s initial weight |
t |
= |
Experimental period in days |
Condition factor (K): This expresses the health status of fish as a result of the experimental treatment and was computed at the beginning and end of the experiment (K1 and K2) using Fulton’s condition factor formula as expressed by Udo and Umoren27 as:
Where:
W |
= |
Weight of fish |
L |
= |
Length of fish |
Survival (%):
Where:
Ni |
= |
Number of cultured fish stocked at the beginning of the experiment |
Nf |
= |
Number of fish alive at the end of the experiment |
Feed utilization
Feed Conversion Ratio (FCR): This is a numerical value used to measure the utilization of feed for growth. The feed conversion ratio was calculated following Udo and Umoren27 as:
Feed Intake (FI): This will be taken as the addition of the amount of feed supplied during the experimental period.
Protein Intake (PI): This is the numerical value of the quantity of protein present in the feed that was fed to the fish during the experimental period and was determined as following Getso et al.28:
Protein intake = Feed intake×Crude protein |
Protein Efficiency Ratio (PER): This index uses growth as a measure of the nutritive value of dietary protein:
Water quality parameters: Water quality parameters such as temperature, pH, dissolved oxygen and ammonia concentration were taken biweekly before feeding using the NIFFR (National institute for freshwater fisheries research, new bussa, Niger State, Nigeria) innovative multitec kit and ammonia by titration with sulfuric acid.
Determination of nutrient digestibility coefficient: Indirect methods of digestibility were applied by using chromium III oxide incorporated into experimental diets as an inert indicator of digestion12. Faecal samples were collected twice a week at regular intervals by slightly pressing the anal region of the fish after seven hours of feeding. The samples that were collected are weighed, ground in a mortar, seal in polythene bags, labelled (according to each dietary treatment code) and kept in a refrigerator before proximate analysis. The indices were calculated as:
Apparent Digestibility of dry matter (ADdm):
Apparent Digestibility of protein (ADp):
Apparent Digestibility of energy (ADe):
Haematological examination
Collection of blood sample: At the end of the feeding trials, three samples of live fish from each treatment were removed. About 10 mL of blood was collected from the caudal peduncle of each fish using a separate heparinized 10 mL disposable syringe, kept into properly labelled sterilized bottles containing EDTA (Ethylenediaminetetraactatic acid) as anticoagulant and transported to the laboratory for analysis according to Sveier et al.29 methods.
Haematocrit (PCV): Heparinized capillary tubes were 75% filled with blood samples by suction pressure and one end was sealed with plasticine. The tubes were centrifuged for 5 min in a haematocrit centrifuge at 3000 r.p.m. The Packed Cell Volumes (PCV) were read by the use of a haematocrit reader. The results were expressed in percentages.
Haemoglobin concentration (Hb): The cyanmethemoglobin method by Sveier et al.29 was used. 0.02 mL of well-mixed blood was added to 4 mL of modified Drabkins solution (a mixture of 250 mg potassium ferricyanide, 200 mg potassium cyanide and 50 mg of potassium dihydrogen phosphate) and the volume was diluted to 1 L with distilled water. The mixture was allowed to stand for 35 min and the haemoglobin concentration (g dL–1) was read photometrically by comparing it with the cyanmethemoglobin standard with the yellow-green filler at 625 nm.
Leucocyte count (WBC): The haemocytometer was used for LC determination with a 0.8 cm objective of the microscope and large squares (area = 1 mm2, depth = 0.1 mm) the volume was 0.1 mm3 and the dilution factor was 20. Four squares were used and the total counts per mm3 were:
20×1×L cells/0.4 = 50×L cells |
Where:
L = Number of leucocytes that were counted
Erythrocytes (RBC): These were determined in heparinized blood diluted by Hayman solution at a ratio of 1:200. Neubauer improved haemocytometer placed on a compound microscope stage was used to count/estimate the erythrocyte population. The number of cells counted, R (average of two fields) was multiplied by the dilution factor and the volume of 1/4000 mm3 (area = 1/4000 mm3, depth = 1/10 mm3) and counting was done in 80 squares with the total volume of 1/50 mm3 the dilution factors is 200:
200×500×R cells = 10,000×R |
Determination of Mean Corpuscular Haemoglobin (MCH): The Mean Corpuscular Haemoglobin (MCH) was calculated using the formula:
Determination of Mean Corpuscular Volume (MCV): The Mean Corpuscular Volume (MCV) was determined as follow:
Determination of Mean Corpuscular Haemoglobin Concentration (MCHC): The Mean Corpuscular Haemoglobin Concentration (MCHC) was calculated using the formula:
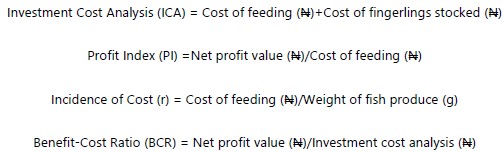
Economic analysis: The economic analyses were computed to estimate the cost of feed required to raise a kilogram of fish using the various experimental diets. The major assumption is that all other operating costs for commercial fish production will remain the same for all diets. Thus, the cost of feed was the only economic criterion in this case. The cost was based on the current prices of the feed ingredients at the time of purchase. The economic evaluations of preparing the diets were calculated from the method of Witeska et al.30 and Agbo et al.31:
 |
Statistical analysis: Data collected were subjected to descriptive statistics, graphical representations and one-way analysis of variance ANOVA. Significant differences between treatment means were compared using the least significant difference at a 5% probability level using IBM SPSS statistics 19.
RESULTS
Proximate compositions of fermented Canavalia ensiformis (FCe) diets: The highest crude protein value was from the control diet (40.36%) and the lowest was from the 100% FCe diet (39.40%). The highest lipid content was from the control diet (7.01%) and the lowest from the 25% FCe diet (6.75%). The highest fibre value was from the 100% FCe diet (5.76%) and the lowest was from the control diet (5.43%). The highest ash content was from the 100% FCe diet (6.60%) and the lowest was from the control diet (6.52%). The highest nitrogen-free extract was from the 100% FCe diet (32.77%) and the lowest was from the control diet (32.18%). The highest dry matter content was from the 75% FCe diet (91.51%) and the lowest was from the 50% FCe diet (91.40%). The highest gross energy value was from the control diet (417.71 kcal g–1) and the lowest was from the 100% FCe diet (414.48 kcal g–1) in Table 2.
Growth performance of Clarias gariepinus fed FCe diets: Growth parameters measured, decreased as fermented Canavalia ensiformis meal inclusion levels increased. The highest and lowest Mean Weight Gains (MWG) were recorded from the control and 100% FCe diets (6.78 and 2.64 g/fish) respectively (Table 3). There were significant differences (p<0.001) between the MWG of the diets. The relative growth rate (RGR) ranged from 162-674%/fish. The highest value was from the control diet and the lowest value was from FCe 100% diet. There was a significant difference (p<0.001) among the diets. Specific Growth Rate (SGR) ranged from 0.46-1.07%/day. The lowest value was recorded from FCe 75% diet and the highest was from the control diet. The highest survival was from control, FCe 25 and 50% diets (80.0%) and the lowest from 75 and 100% FCe diets (30.0 and 20.0%), respectively. There were significant differences (p<0.001) between the highest and lowest survival of fish-fed FCe diets. To compare the initial and final condition factors K1 and K2, the highest K1 was from fish fed 50% FCe diet (1.70) and the lowest was from fish fed 25% FCe diets (1.38) while the highest K2 was from fish fed the control diet (1.67) and the lowest was from fish fed FCe 50% diet (1.28). There was no significant difference (p>0.05) between K1 and K2.
| Table 2: | Proximate compositions of fermented Canavalia ensiformis diets on dry matter basis | |||
| Nutrients | FCe (0%) | FCe (25%) | FCe (50%) | FCe (75%) | FCe (100%) |
| Protein % | 40.36 | 40.25 | 40.15 | 39.45 | 39.4 |
| Fat % | 7.01 | 6.75 | 6.84 | 6.95 | 6.97 |
| Fibre % | 5.43 | 5.66 | 5.72 | 5.75 | 5.76 |
| Ash % | 6.52 | 6.55 | 6.55 | 6.57 | 6.6 |
| NFE % | 32.18 | 32.24 | 32.14 | 32.79 | 32.77 |
| Dry matter % | 91.5 | 91.45 | 91.4 | 91.51 | 91.5 |
| Calculated analysis | |||||
| Gross energy (kcal g–1) | 417.71 | 414.98 | 414.84 | 414.66 | 414.48 |
| Digestible energy (kcal g–1) | 273.81 | 271.43 | 271.57 | 271.09 | 271.02 |
| Metabolizable energy (kcal g–1) | 3202.52 | 3180.52 | 3180.56 | 3186.64 | 3185.7 |
| FCe: Fermented Canavalia ensiformis | |||||
| Table 3: | Growth parameters and survival rate of Clarias gariepinus fingerlings fed femented Canavalia ensiformis diets | |||
| Parameters | Control (0%) |
FCe (25%) |
Fce (50%) |
Fce (75%) |
Fce (100%) |
SEM |
| Total initial weight (g) | 9.6±0.52 |
9.6±0.52 |
9.6±0.52 |
9.66±0.57 |
9.6±0.52 |
0.31ns |
| Total final weight (g) | 61.86±6.11a |
28.53±2.57b |
24.0±2.88b |
11.2±1.44c |
9.9±0.65c |
1.91*** |
| Mean initial weight (g/fish) | 0.96±0.05 |
0.93±0.05 |
0.96±0.05 |
0.96±0.05 |
0.96±0.05 |
0.03ns |
| Mean final weight (g/fish) | 7.73±0.76a |
3.56±0.32b |
3.0±0.36bc |
2.8±0.36bbc |
2.5±0.20c |
0.25*** |
| Mean weight gain (g/fish) | 6.77±0.71a |
2.63±0.27b |
2.04±0.31bc |
1.84±0.31bc |
1.54±0.15c |
0.25*** |
| Mean weekly weight gain (g/fish/week) | 0.56±0.71a |
0.21±0.27b |
0.17±0.31bc |
0.15±0.31bc |
0.12±0.15c |
0.02*** |
| Mean initial length (cm/fish) | 4.06±0.51 |
4.06±0.51 |
3.83±0.35 |
4.1±0.36 |
3.96±0.15 |
0.23ns |
| Mean final length (cm/fish) | 7.73±0.80a |
6.23±0.55b |
6.16±0.25b |
5.66±0.20b |
5.66±0.35b |
0.27*** |
| Relative growth rate (%/fish) | 673.0±0.71a |
282.7±0.27b |
212.5±0.31bc |
191.6±0.31bc |
160±0.15c |
34.43*** |
| Specific growth rate (%/day) | 1.06±0.71a |
0.69±0.27b |
0.57±0.31c |
0.45±0.31c |
0.48±0.15c |
0.03*** |
| K1 | 1.43 |
1.38 |
1.7 |
1.39 |
1.54 |
0.25ns |
| K2 | 1.67 |
1.47 |
1.28 |
1.46 |
1.5 |
0.21ns |
| Survival (%) | 80a |
80a |
80a |
30b |
20c |
2.12*** |
| Mean±Std on the same row with different superscripts are significantly different (p<0.001), ***SEM: Standard error of the mean, (p<0.001), ns: Not significant (p>0.05) and FCe: Fermented Canavalia ensiformis | ||||||
Feed intake and nutrient utilization of Clarias gariepinus fed fermented Canavalia ensiformis (FCe) diets: The highest Mean Feed Intake (MFI) was obtained from fish fed a control diet (14.07 g/fish) and the lowest was from fish fed FCe 100% diet (3.4 g/fish), there was a significant difference (p<0.001) in the MFI of the fish fed the diets. The Voluntary Feed Intake (VFI) ranged between 1.16-2.92 g/fish. The highest value was from the fish fed the control diet and the lowest was from the fish-fed FCe 100% diet (Table 4). There was a significant difference (p<0.001) in the VFI of the fish fed the diets The highest Feed Acceptability Index (FAI) was from the control diet (0.228%) and the lowest was from the fish-fed FCe 100% diet (0.086%). There were significant differences (p<0.001) between the FAI of the control diet and FCe diets. The highest Feed Conversion Ratio (FCR) was in the fish-fed FCe 50% diet (3.27) and the lowest was from the fish-fed control diet (2.07). There was a significant difference (p<0.001) between the FCR of the control diet and FCe diets. The protein intake ranged from 133.9-567.8 g/100 g diet/fish. The highest value was obtained from fish fed the control diet and the lowest was from fish fed FCe 100% diet. There was a significant difference.
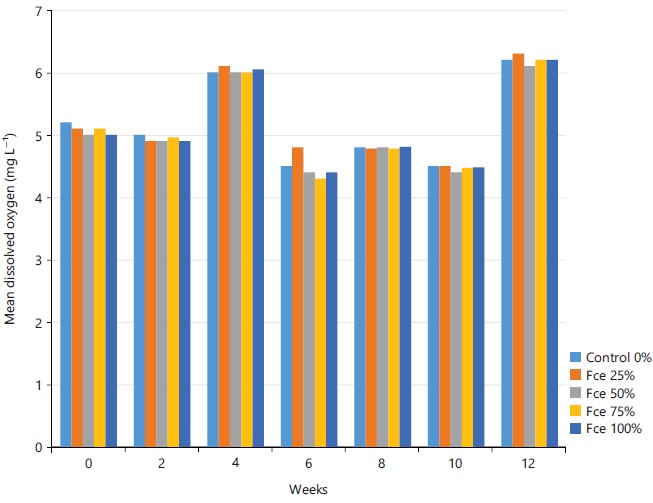
Mean water quality parameters of fish fed fermented Canavalia ensiformis diets: The biweekly mean water quality parameters in the holding facilities during the feeding period are presented in figures (Fig. 1-4). The highest temperature (27.8°C) was recorded from 0% control and 25% FCe diets in week 2 while the lowest (23.1°C) was from the 25% FCe diet in week 12. The highest dissolved oxygen (6.3 mg L–1) was recorded from the 25% FCe diet in week 12 while the lowest (4.3 mg L–1) was from the 75% FCe diet in week 6. The highest pH (7.3) was recorded from the 75% FCe diet in week 4 while the lowest (4.8) from 100% FCe in week 10 and the highest ammonia (0.37 mg L–1) was from the 100% FCe diet in week 10 while the lowest (0.01 mg L–1) was from the five (0, 25, 50, 75 and 100%) FCe diets in week 0. The results of the water quality parameters were significantly (p<0.001) different across the treatment groups.

|
|

|

|
| Table 4: | Feed intake and nutrient utilization indices of Clarias gariepinus fingerlings fed fermented Canavalia ensiformis diets | |||
| Parameters | Control (0%) | FCe (25%) | Fce (50%) | Fce (75%) | Fce (100%) | SEM |
| Total feed intake (g) | 1181.88a | 642.6b | 561.12c | 338.52d | 285.6e | 2.19*** |
| Mean feed intake (g/fish) | 14.07±0.17a | 7.65±0.11b | 6.68±0.14c | 4.03±0.13d | 3.4±0.17e | 0.02*** |
| Biweekly feed intake (g/week) | 196.98a | 107.1b | 93.52c | 56.42d | 47.6e | 0.31*** |
| Voluntary feed intake (g/fish) | 2.92±0.14a | 2.02±0.26a | 2.01±0.34a | 1.27±0.31b | 1.16±0.68b | 0.09*** |
| Feed acceptability index (%) | 0.228±0.02a | 0.153±0.01b | 0.142±0.01c | 0.092±0.01d | 0.086±0.01e | 0.01*** |
| Feed conversion ratio | 2.07±0.23b | 2.9±0.40a | 3.27±0.45a | 2.19±0.41b | 2.2±1.13b | 0.00*** |
| Protein intake (g/100g diet/fish) | 567.8±0.01a | 307.9±0.01b | 268.2±0.01c | 158.9±0.01d | 133.9±0.01e | 1.03*** |
| Protein efficiency ratio | 0.13a | 0.052b | 0.042b | 0.038b | 0.036b | 0.00*** |
| Mean±Std on the same row with different superscripts are significantly different (p<0.001), ***SEM: Standard error of the mean and FCe: Fermented Canavalia ensiformis | ||||||
| Table 5: | Nutrient digestibility coefficients of Clarias gariepinus fed FCe diets | |||
| Indices (%) | Control (0%) |
FCe (25%) |
Fce (50%) |
Fce (75%) |
Fce (100%) |
SEM |
| Dry matter digestibility | 88.8±0.1a |
87.1±0.1b |
85.5±0.1c |
83.9±0.1d |
82.3±0.1e |
0.05*** |
| Protein digestibility | 74.5±0.1a |
70.0±1.0b |
65.0±1.0c |
60.7±0.1d |
57.8±0.1e |
0.36*** |
| Lipid digestibility | 41.56±0.01a |
40.66±0.00b |
39.61±0.01c |
35.84±0.00e |
38.88±0.01d |
0.01*** |
| Energy digestibility | 70.7±0.1a |
69.0±1.00b |
68.0±1.00bc |
67.1±0.1cd |
66.3±0.1d |
0.36*** |
| Mean±Std on the same row with different superscripts are significantly different (p<0.001), ***SEM: Standard error of the mean and FCe: Fermented Canavalia ensiformis | ||||||
| Table 6: | Some haematological indices of Clarias gariepinus Fed FCe diets | |||
| Indices | Control (0%) |
FCe (25%) |
Fce (50%) |
Fce (75%) |
Fce (100%) |
SEM |
| PCV (%) | 35.4±0.51a |
34.05±0.81b |
32.65±1.05c |
31.46±0.47cd |
30.35±0.36d |
0.00*** |
| RBC (×106) | 1.40±0.41bc |
1.38±0.39c |
1.30±0.31d |
1.25±0.26ab |
1.14±0.15a |
0.85*** |
| WBC (×103) | 20.5±1.25bc |
19.35±1.02c |
16.75±0.76d |
21.83±0.84a |
22.94±0.95a |
0.01*** |
| Hb (g dL–1) | 10.6±0.82a |
9.85±1.3ab |
9.23±0.44abc |
8.75±0.76bc |
8.09±0.85c |
0.04*** |
| MCV (dL) | 252.85±1.08b |
246.73±0.85d |
251.15±0.16c |
251.68±0.69bc |
266.22±0.23a |
0.01*** |
| MCH (Pg) | 75.71±0.83a |
71.37±0.82b |
71.0±1.00b |
70.0±1.00b |
70.96±0.97b |
0.01*** |
| MCHC (g dL–1) | 29.94±0.95a |
28.92±1.03ab |
28.26±0.81abc |
27.81±0.82bc |
26.65±1.05c |
0.02*** |
| Mean±Std on the same row with different superscripts are significantly different (p<0.01), (p<0.001), ***SEM: Standard error of the mean, FCe: Fermented Canavalia ensiformis, PVC: Packed cell volume, RBC: Red blood cell, WBC: White blood cell, Hb: Haemoglobin, MCV: Mean corpuscular volume, MCH: Mean corpuscular haemoglobin and MCHC: Mean corpuscular haemoglobin concentration | ||||||
Nutrient digestibility coefficients of Clarias gariepinus fed FCe diets: Table 5 showed that the highest dry matter value was from the control diet (88.8%) and the lowest was from the 100% diet (82.3%) diet. The highest protein value was from the control diet (74.5%) and the lowest was from the 100% diet (57.8%). The highest lipid value was from the control diet (41.56%) and the lowest value was from the 75% diet (35.84%). The highest energy value was from the control diet (70.7%) and the lowest value was from the 100% diet (66.3%). There was a significant difference (p<0.001) in nutrient digestibility.
Some haematological indices of Clarias gariepinus fed FCe diets: Table 6 showed that the highest PCV value was from the control diet (35.4%) and the lowest from the 100% diet (30.35%). The highest RBC value was from the control diet (1.40) and the lowest was from 100% (1.14). The highest WBC value was from the 100% diet (22.94) and the lowest from the 50% diet (16.75). The highest Hb value was from the control diet (10.6 g dL–1) and the lowest from the 100% diet (8.09 g dL–1). The highest MCV value was from the 100% diet (266.22 dL) and the lowest from the 25% diet (246.73 dL).
An economic evaluation of fermented Canavalia ensiformis (FCe) diets fed to Clarias gariepinus for six months: The result of the production cost of FCe diets (Table 7) showed that the highest profit index was from FCe 75% diet (3.0) and the lowest was from the control and FCe 25% diets (2.8). The highest net profit was from the control diet (1142.5) and the lowest was from FCe 100% diet (838.6). The highest benefit-cost ratio was from FCe 25% diet (7.2) and the lowest was from the control and FCe 100% diets (6.5), there was a significant difference (p<0.001) in all the parameters across the treatment groups.
| Table 7: | Economic evaluation of Clarias gariepinus fingerlings fed fermented Canavalia ensiformis diets for six months | |||
| Indices | Control (0%) |
FCe (25%) |
Fce (50%) |
Fce (75%) |
Fce (100%) |
SEM |
| Cost of feed (N~) | 479.5a |
443.5b |
407.5c |
363.5d |
336.5e |
0.18*** |
| Cost of feeding (N~) | 67.5a |
33.9b |
27.2c |
14.6d |
11.4e |
0.12*** |
| Estimated investment cost (N~) | 207.5a |
173.9b |
167.2c |
154.6d |
151.4e |
0.18*** |
| Net profit value (N~) | 1350a |
1260b |
1170c |
1080d |
990e |
0.58*** |
| profit index (N~) | 2.8b |
2.8b |
2.9ab |
3.0a |
2.9ab |
0.06*** |
| Incidence of cost | 120.5c |
161.4a |
160b |
97.3d |
95e |
0.36*** |
| Benefit cost ratio | 6.5c |
7.2a |
7.0b |
7.0b |
6.5c |
0.05*** |
| Net profit (N~) | 1142.5a |
1086.1b |
1002.8c |
925.4d |
838.6e |
0.05*** |
| Values on the same row with different superscripts are significantly different (p<0.001), ***SEM: Standard error of the mean and FCe: Fermented Canavalia ensiformis | ||||||
DISCUSSION
In applied research and practice, weight gain and specific growth rate are usually considered the most important measurement of productivity of diet31,32 and a reliable indication of a marketable product. The fact that growth was recorded from all experimental diets, indicated that the fish was able to convert the protein in the feed to muscles as reported by Sogbesan and Ugwumba33. The growth performance and nutrient utilization of fish-fed FCe diets were significantly different (p<0.001) from the control. The control treatment had higher values than the FCe treatments. In terms of FCe treatments, better performances were recorded from 25% and followed by 50% FCe treatment and agree with the report of Sogbesan et al.31 on fermented Sunflower meal diet34. This study disagrees with35 those who reported better performance in (D3) fish fed a 20% fermented sicklepod seed meal diet. In this study, the reason for the difference in acceptability of the diets among treatments agrees with earlier reports by researchers36-38. The researchers suggested that when alternative protein sources especially plant protein sources are used in the fish diet, the palatability and attractiveness of the diets are usually affected. As suggested by Ahmad39 proper utilization of dietary protein is dependent on the good quality or amino acid balance of the protein sources. Nguyen et al.40 stated that the Weight Gain (WG) of young fish is a reliable indicator of nutritional efficiency. This present study showed that fermentation and inclusion levels both affected the weight gained. This agrees with the findings of some studies40-44, that one of the major limitations of using alternative plant protein sources in fish feeding is the changes in palatability and the presence of anti-nutrition factors in the ingredient. The reduction in feed intake due to the unpalatability may lead to deterioration in growth performance and feed utilization. A reduction in growth and nutrient utilization in fish fed 75 and 100% FCe diets was observed, this reduction observed could be attributed not only to the dietary amino acid profile of the ingredient but also to the presence of anti-nutritional factors. This assertion is in line with the findings of some studies45-47 that higher inclusion levels of most plant protein source base meals resulted in poor growth and nutrient utilization. The best Feed Conversion Ratio (FCR) was recorded in the control diet, followed by the 25% FCe diet which is an indication of an optimum level of utilization of the diet by the Clarias gariepinus fingerlings, this corresponds with Wang et al.48, who stated that the lower the FCR, the better the feed utilization by the fish and observations made by scientists49-51 in related studies on feeding trials. The Protein Efficiency Ratio (PER) is known to be regulated by the non-protein energy input of the diet and is a good measure of the protein-sparing effect of lipids and/or carbohydrates52,53. The general well-being of the fish-fed fermented Canavalia ensiformis diets is expressed by the condition factor (K). The values were above 1.0 and agreed with54. Survival rate was higher in control, 25 and 50% treatments while lower in 75 and 100% treatments and this might be due to the presence of antinutrients in the diets or other extraneous factors which agreed with Jamabo et al.55, who reported that mortality might not be due to the antinutrients in the diets alone but also to any other extraneous factors such as stress resulting from handling.
These water quality parameters ranges for all the treatment diets were within the tolerable limit in aquaculture54,56-58 recommended dissolved oxygen levels of between 4-8 mg L–1 in the pond and the values observed during the experimental period fall within this range. Lawson59 reported that when the DO level is consistently between 1.5-5 mg L–1, fish will be alive, but feed intake will reduce. The growth rate will also reduce and high Feed Conversion Ratios (FCR) will be recorded. When DO levels are lower than 1.5 mg L–1, fish will be stressed and they will die. The periods of achieving desired weights in fish will be lengthened and ultimate loss on investment will occur. The range in the average temperature recorded during the experimental period was probably because all the treatments were outdoors and faced with environmental factor variations. Anjulo et al.60 reported that for African Catfish, an acceptable temperature range is between 26-32°C. When the water temperature in the ponds consistently stays between 16 and 26°C, feed intake reduces and the fish growth rate also drags tremendously. A farmer will record high FCR and the fish will also be stressed. Prolonged stress can open up the fish to opportunistic infections. When fish are consistently exposed to temperatures below 15°C, fish growth will ultimately stop and death is just around the corner. Low temperature negatively affects the rates at which wastes are converted into water. However, when the water temperature is above 32°C, the resultant effect on the African Catfish is not good at all. This is because oxygen is not readily soluble in very warm water. High temperatures in ponds will stress the fish and eventually lead to death60. Anjulo et al.60 reported that pH is the level of the hydrogen ion present in the water. For the fish in the pond, the acceptable pH value is between 6.5-7.5. When it is below 4, fish will die due to water acidity. When pH is constantly between 4-6, fish will be alive, but due to stress, will experience slow growth. Feed intake will be highly staggered and reduced. The FCR will also be very high. In fact, for the observant fish farmer, low pH in pond water is an indication of high CO2, (carbon dioxide) in the water. High pH values of between 9-11 in pond water will also retard fish growth. Fish will ultimately die when pH levels rise above 11. Low pH aids in higher proportions of ionized ammonia which is less toxic to fish. The reverse is the case with high pH in water.
There is a slight increase in the digestibility coefficient of fishes fed fermented Canavalia ensiformis (FCe) at a 25% level than those fed toasted Canavalia ensiformis (TCe) diets, which agrees with the report of Fagbenro et al.12 that the likely thermostable antinutrients in the jack bean seeds formed a good proportion of the solubilized and removed nitrogenous compounds, which might be partly responsible for the improvement in the nutritive values of processed jack bean seeds. The high dry matter digestibility by Clarias gariepinus may be due to the crude fibre content of the diets. This finding is similar to the report of Ologbobo61 that dry matter digestibility could be affected by the fibre content of the diet. The reduction in crude protein digestibility may be due to the presence of the anti-nutrients. Tannins have been implicated in reducing protein digestibility62. The relatively high apparent digestibility coefficient of energy recorded in this study is similar to the values recorded by scientists63,64 of the same seed meal fed to Oreochromis niloticus. Osuigwe et al.65 and Bhagya et al.66 revealed that cooking improved gross energy digestibility.
The decrease in haemoglobin, haematocrit and RBC observed with increasing dietary fermented Canavalia seed meal as compared with the control diet could be a result of the anti-nutritional factors still present in FCe diets at higher inclusion levels which agrees with the report of Gboshe and Ukorebi67. Some of these anti-nutritional factors are known to cause some negative effects on some haematological parameters. The Con-A causes agglutination of red blood cells in monogastric68, while saponins are known to cause erythrocyte haemolysis and reduction of blood69. Probably the increasing presence of anti-nutritional factors in increasing dietary Canavalia caused the inferior haematological parameters observed in C. gariepinus fed such diets. This is in line with the findings of Jimoh et al.70 that nutritional toxicity is associated with anaemia. Adogu et al.71 equally observed that gossypol an anti-nutritional factor found in some legumes severely reduced blood PCV and Hb concentration in rainbow trout. When viewed from the perspective of diet processing type, it was observed that C. gariepinus fed the control diet had PCV, RBC count, WBC count and Hb concentration that were higher and significantly (p<0.001) different from the values of those fed fermented Canavalia diets which were, in turn, higher than those fed toasted Canavalia diets. According to Seena et al.72 RBC greater than 1x10⁶/mm3 is considered high and is indicative of the high oxygen-carrying capacity of the blood which is characteristic of fishes capable of aerial respiration and with high activity. The better performance of C. gariepinus-fed fermented Canavalia diets to those fed toasted Canavalia diets is an indication that fermentation significantly improved the quality of FCe meals67. The improvement may be due to among other factors inactivation of the anti-nutritional factors present in Canavalia as earlier reported by the works of Megbowon et al.73 and the transformation of some of the component nutrients to non-toxic more readily digestible absorbable forms Gboshe and Ukorebi67 and Charo-Karisa et al.74. It is of importance to note that despite the reduction in the levels of haematological values observed, they were still within the normal ranges reported for C. gariepinus75.
The economic evaluation of feeding Clarias gariepinus fingerlings with the experimental diets showed that FCe 25% had the highest benefit: Cost ratio. The positive benefit: Cost ratio recorded in all the diets, showed that Clarias fingerlings can be economically reared on all diets. However, the result further revealed that the substitution of fermented Canavalia ensiformis seed meal for soybean meal lowered the cost of diet production, which is an indication of a more cost-efficient and cheaper non-convectional ingredient relative to the soybean meal by Hassaan et al.34 and Charo-Karisa et al.74. This is similar to the report that Non-Conventional Feed Resources (NCFRs) are very cheap by-products or wastes from agriculture, farm-made feeds and processing industries34. It implies that fermented Canavalia ensiformis seed diets at a 25% inclusion level can be fed to Clarias gariepinus fingerlings with better growth performance, haematology, digestibility and economic evaluations.
CONCLUSION
Optimal growth and weight gain in this study were obtained at an inclusion level of 25% of fermented Canavalia ensiformis meal. It is concluded that fermented Canavalia ensiformis meal can be used as a growth-promoting agent in the diet of Clarias gariepinus with better haematology and economic evaluation.
SIGNIFICANCE STATEMENT
This study discovered that Fermented Canavalia ensiformis diets can be beneficial for Clarias gariepinus fingerling’s growth. This study will help the researchers to uncover the critical areas of inclusion levels that many researchers were not able to explore. Thus a new theory on Canavalia ensiformis may be arrived at.
REFERENCES
- Hardy, R.W., 2010. Utilization of plant proteins in fish diets: Effects of global demand and supplies of fishmeal. Aquacult. Res., 41: 770-776.
- Siddhuraju, P. and K. Becker, 2001. Species/variety differences in biochemical composition and nutritional value of Indian tribal legumes of the genus Canavalia. Nahrung, 45: 224-233.
- Sarker, P.K., M.M. Gamble, S. Kelson and A.R. Kapuscinski, 2016. Nile tilapia (Oreochromis niloticus) show high digestibility of lipid and fatty acids from marine Schizochytrium sp. and of protein and essential amino acids from freshwater Spirulina sp. feed ingredients. Aquacult. Nutr., 22: 109-119.
- Sridhar, K.R. and R. Bhat, 2007. Agrobotanical, nutritional and bioactive potential of unconventional legume-Mucuna. Livest. Res. Rural Dev., Vol. 19.
- Wojciechowski, M.F., M. Lavin and M.J. Sanderson, 2004. A phylogeny of legumes (Leguminosae) based on analysis of the plastid matK gene resolves many well-supported subclades within the family. Am. J. Bot., 91: 1846-1862.
- Kalidass, C. and V.R. Mohan, 2012. Biochemical composition and nutritional assessment of selected under-utilized food legume of the genus Rhynchosia. Int. Food Res. J., 19: 977-984.
- Siddhuraju, P., K. Becker and H.P.S. Makkar, 2002. Chemical composition, protein fractionation, essential amino acid potential and antimetabolic constituents of an unconventional legume, Gila bean (Entada phaseoloides Merrill) seed kernel. J. Sci. Food Agric., 82: 192-202.
- Escudero, N.L., F. Zirulnik, N.N. Gomez, S.I. Mucciarelli and M.S. Gimenez, 2006. Influence of a protein concentrate from Amaranthus cruentus seeds on lipid metabolism. Exp. Biol. Med., 231: 50-59.
- Arivalagan, M., T.V. Prasad, H. Singh and A. Kumar, 2014. Variability in biochemical and mineral composition of Mucuna pruriens (L.) DC.-An underutilized tropical legume. Legume Res., 37: 483-491.
- Inbasekar, K., 2014. Pulses production in India: Challenges and strategies. Econ. Aff., 59: 403-414.
- Famurewa, J.A.V. and A.G.O. Raji, 2005. Parameters affecting milling qualities of undefatted soybeans (Glycine max, l. Merill) (1): Selected thermal treatment. Int. J. Food Eng., Vol. 1, No. 11.
- Fagbenro, O.A., E.O. Adeparusi and W.A. Jimoh, 2007. Evaluation and nutrient quality of detoxified Jackbean seeds, cooked in distilled water or trona solution, as a substitute for soybean meal in nile tilapia, Oreochromis niloticus, diets. J. Appl. Aquacult., 19: 83-100.
- Tiamiyu, L.O., V.T. Okomoda and P. Akpa, 2016. Nutritional profile of toasted Canavalia ensiformis seed and its potential as partially replacement for soybean in the diet of Clarias gariepinus. Braz. J. Aquat. Sci. Technol., 20: 12-17.
- Solomon, S.G., V.T. Okomoda and O. Oguche, 2018. Nutritional value of raw Canavalia ensiformis and its utilization as partial replacement for soybean meal in the diet of Clarias gariepinus (Burchell, 1822) fingerlings. Food Sci. Nutr., 6: 207-213.
- Fagbenro, O.A., E.O. Adeparusi and W.A. Jimoh, 2013. Haematological profile of blood of African catfish (Clarias gariepinus, Burchell, 1822) fed sunflower and sesame meal based diets. J. Fish. Aquat. Sci., 8: 80-86.
- Doss, A., M. Pugalenthi, V.G. Vadivel, G. Subhashini and S.R. Anitha, 2011. Effects of processing technique on the nutritional composition and antinutritients content of under-utilized food legume Canavalia ensiformis L. DC. Int. Food Res. J., 18: 965-970.
- Akande, K.E., U.D. Doma, H.O. Agu and H.M. Adamu, 2010. Major antinutrients found in plant protein sources: Their effect on nutrition. Pak. J. Nutr., 9: 827-832.
- Audu, S.S. and M.O. Aremu, 2011. Effect of processing on chemical composition of red kidney bean (Phaseolus vulgaris L.) flour. Pak. J. Nutr., 10: 1069-1075.
- Cheng, Z.J., R.W. Hardy and J.L. Usry, 2003. Plant protein ingredients with lysine supplementation reduce dietary protein level in rainbow trout (Oncorhynchus mykiss) diets, and reduce ammonia nitrogen and soluble phosphorus excretion. Aquaculture, 218: 553-565.
- Okomoda, V.T., L.O. Tiamiyu and S.G. Uma, 2016. Effects of hydrothermal processing on nutritional value of Canavalia ensiformis and its utilization by Clarias gariepinus (Burchell, 1822) fingerlings. Aquacult. Rep., 3: 214-219.
- Alonso, R., A. Aguirre and F. Marzo, 2000. Effects of extrusion and traditional processing methods on antinutrients and in vitro digestibility of protein and starch in faba and kidney beans. Food Chem., 68: 159-165.
- Francis, G., H.P.S. Makkar and K. Becker, 2001. Antinutritional factors present in plant-derived alternate fish feed ingredients and their effects in fish. Aquaculture, 199: 197-227.
- Pandey, A., 2003. Solid-state fermentation. Biochem. Eng. J., 13: 81-84.
- Louis, H., O.U. Akakuru, M.N. Linus, J. Innocent and P.I. Amos, 2018. Qualitative and quantitative phytochemical analyses of Sclerocarya birrea and Sterculia setigera in Kem and Yola, Adamawa State, Nigeria. Am. J. Biomed. Res., 6: 1-10.
- Larese, M.G., R.M. Craviotto, M.R. Arango, C. Gallo and P.M. Granitto, 2012. Legume Identification by Leaf Vein Images Classification. In: Progress in Pattern Recognition, Image Analysis, Computer Vision, and Applications, Alvarez, L., M. Mejail, L. Gomez and J. Jacobo (Eds.), Springer, Berlin, Heidelberg, ISBN: 978-3-642-33274-6, pp: 447-454.
- Jiyana, S.T., M.M. Ratsaka, K.J. Leeuw and K.R. Mbatha, 2022. Impacts of graded dietary fiber levels on feed efficiency and carbon footprint of two beef breeds. Livest. Sci., Vol. 258, 104867.
- Udo, I.U. and U.E. Umoren, 2011. Nutritional evaluation of some locally available ingredients use for least-cost ration formulation for African catfish (Clarias gariepinus) in Nigeria. Asian J. Agric. Res., 5: 164-175.
- Getso, B.U., J.M. Abdullahi and I.A. Yola, 2017. Length-weight relationship and condition factor of Clarias gariepinus and Oreochromis niloticus of Wudil River, Kano, Nigeria. Agro-Science, 16: 1-4.
- Sveier, H., A.J. Raae and E. Lied, 2000. Growth and protein turnover in Atlantic salmon (Salmo salar L.); the effect of dietary protein level and protein particle size. Aquaculture, 185: 101-120.
- Witeska, M., E. Kondera, K. Ługowska and B. Bojarski, 2022. Hematological methods in fish-not only for beginners. Aquaculture, Vol. 547, 737498.
- Agbo, N.W., N. Madalla and K. Jauncey, 2015. Mixtures of oilseed meals as dietary protein sources in diets of juvenile Nile tilapia (Oreochromis niloticus L.). J. Sci. Technol., 35: 11-24.
- Oyetunji, A.A., A. Olubunmi, S.O. Sakiru, A.M. Adewale and A.B. Taiwo, 2021. Growth efficiency and profitability indices of African catfish (Clarias gariepinus) fingerlings fed with different levels of Adansonia digitata (Baobab) seed meal. Afr. J. Agric. Res., 17: 1008-1015.
- Sogbesan, A.O. and A.A.A. Ugwumba, 2008. Nutritional values of some non-conventional animal protein feedstuffs used as fishmeal supplement in aquaculture practices in Nigeria. Turk. J. Fish. Aquat. Sci., 8: 159-164.
- Hassaan, M.S., M.A. Soltan, E.Y. Mohammady, M.A. Elashry, E.R. El-Haroun and S.J. Davies, 2018. Growth and physiological responses of Nile tilapia, Oreochromis niloticus fed dietary fermented sunflower meal inoculated with Saccharomyces cerevisiae and Bacillus subtilis. Aquaculture, 495: 592-601.
- Farombi, E.O., 2003. African indigenous plants with chemotherapeutic potentials and biotechnological approach to the production of bioactive prophylactic agents. Afr. J. Biotechnol., 2: 662-671.
- Bake, G.G., A.A. Yusuf, M. Endo, Y. Haga, S. Satoh, S.O.E. Sadiku and T. Takeuchi, 2015. Preliminary investigation on the inclusion of fermented sickle pod Senna obtusifolia seed meal as an ingredient in the diet of Clarias gariepinus fingerlings. Int. J. Curr. Res. Biosci. Plant Biol., 2: 70-80.
- Riche, M., N.L. Trottier, P.K. Ku and D.L. Garling, 2001. Apparent digestibility of crude protein and apparent availability of individual amino acids in tilapia (Oreochromis niloticus) fed phytase pretreated soybean meal diets. Fish Physiol. Biochem., 25: 181-194.
- Riche, M. and D.L. Garling Jr, 2004. Effect of phytic acid on growth and nitrogen retention in tilapia Oreochromis niloticus L. Aquacult. Nutr., 10: 389-400.
- Ahmad, M.H., 2008. Evaluation of Gambusia, Gambusia affinis, fish meal in practical diets for fry Nile tilapia, Oreochromis niloticus. J. World Aquacult. Soc., 39: 243-250.
- Nguyen, T.N., D.A. Davis and I.P. Saoud, 2009. Evaluation of alternative protein sources to replace fish meal in practical diets for juvenile tilapia, Oreochromis spp. J. World Aquacult. Soc., 40: 113-121.
- Diarra, S.S., 2021. Prospects for the utilization of Senna obtusifolia products as protein supplements for poultry. Poult. Sci., Vol. 100.
- Rodriguez-Serna, M., M.A. Olvera-Novoa and C. Carmona-Osalde, 1996. Nutritional value of animal by-product meal in practical diets for Nile tilapia Oreochromis niloticus (L.) fry. Aquacult. Res., 27: 67-73.
- Jimoh, W.A., O.A. Fagbenro and E.O. Adeparusi, 2014. Response of African catfish, Clarias gariepinus (Burchell 1822), fingerlings fed diets containing differently timed wet-heat-treated sesame (Sesamum indicum) seedmeal. Agric. Sci., 5: 1159-1171.
- Samtiya, M., R.E. Aluko and T. Dhewa, 2020. Plant food anti-nutritional factors and their reduction strategies: An overview. Food Prod. Process. Nutr., Vol. 2:6.
- Siddhuraju, P. and K. Becker, 2003. Comparative nutritional evaluation of differentially processed mucuna seeds [Mucuna pruriens (L.) DC. var. utilis (Wall ex Wight) Baker ex Burck] on growth performance, feed utilization and body composition in Nile tilapia (Oreochromis niloticus L.). Aquacult. Res., 34: 487-500.
- Davies, S., O.A. Fagbenro., A. Abdel-Waritho and L. Diler, 2000. Use of oil seeds residues as fishmeal replacer in diets fed to Nile tilapia, Oreochromis niloticus. Appl. Trop. Agric., 5: 1-10.
- Jimoh, W.A. and H.T. Aroyehun, 2011. Evaluation of cooked and mechanically defatted sesame (Sesamum indicum) seed meal as a replacer for soybean meal in the diet of African catfish (Clarias gariepinus). Turk. J. Fish. Aquat. Sci., 11: 185-190.
- Wang, Q., Z. Xu and Q. Ai, 2021. Arginine metabolism and its functions in growth, nutrient utilization, and immunonutrition of fish. Anim. Nutr., 7: 716-727.
- Bake, G.G., O. Wasiu, D.C. Nwangwu, A. Adam, F.B Yakubu, A.O. Ricketts and A.B. Gana, 2020. Growth response, nutrient utilization and apparent nutrient digestibility of nile tilapia (Oreochromis niloticus) fingerlings fed varying inclusion levels of germinated tropical kudzu (Pueraria phaseoloides) seed meal. Int. J. Zool. Appl. Biosci., 5: 264-272.
- Balogun, B.I., S.J. Oniye, J. Auta, C.A.M. Lakpini and F.O. Abeke, 2016. Growth performance and feed utilization of Clarias gariepinus (Teugels) fed different dietary levels of soaked Bauhinia Monandra (Kutz) seed meal. J. Food Res., 5: 97-106.
- Shabbir, S., M. Salim and M. Rashid, 2003. Study on the Feed Conversion Ratio (FCR) in major carp Cirrhinus mrigala fed on sunflower meal, wheat bran and maize gluten. Pak. Vet. J., 23: 1-3.
- Jabeen, S., M. Salim and P. Akhtar, 2004. Feed conversion ratio of major carp Cirrhinus mrigala fingerlings fed on cotton seed meal, fish meal and barley. Pak. Vet. J., 24: 42-45.
- Ochang, S.N., O.A. Fagbenro and O.T. Adebayo, 2007. Growth performance, body composition, haematology and product quality of the African catfish (Clarias gariepinus) fed diets with palm oil. Pak. J. Nutr., 6: 452-459.
- Tibbetts, S.M., S.P. Lall and J.E. Milley, 2005. Effects of dietary protein and lipid levels and DP DE-1 ratio on growth, feed utilization and hepatosomatic index of juvenile haddock, Melanogrammus aeglefinus L. Aquacult. Nutr., 11: 67-75.
- Jamabo, N.A., F.B. Legborsi and A.A. Lamidi, 2020. Growth performance and haematological responses of Oreochromis niloticus (Linnaeus) fingerlings fed pigeon pea [Cajanus cajan (L.) Millsp]. Global J. Fish. Aquacult., 8: 541-547.
- Zhang, W., B. Tan, K. Liu, X. Dong and Q. Yang et al., 2019. Effects of different dietary lipids on growth, body composition and lipid metabolism-related enzymes and genes in juvenile largemouth bass, Micropterus salmoides. Aquacult. Nutr., 25: 1318-1326.
- Adekoya, R.A., H.A. Awojobi and B.B.A. Taiwo, 2004. The effect of partial replacement of maize with full fat palm kernel on the performance of laying hens. J. Agric. For. Soc. Sci., 2: 89-94.
- Omotayo, A.E., O.A. Efetie, G. Oyetibo, M.O. Ilori and O.O. Amund, 2011. Degradation of aviation fuel by microorganisms isolated from tropical polluted soils. Int. J. Biol. Chem. Sci., 5: 698-708.
- Lawson, T.B., 1995. Fundamentals of Aquacultural Engineering. 1st Edn., Springer, New York, ISBN: 978-1-4613-0479-1, Pages: 364.
- Anjulo, M.T., M.B. Doda and C.K. Kanido, 2021. Determination of selected metals and nutritional compositions of pigeon pea (Cajanus cajan) cultivated in Wolaita Zone, Ethiopia. J. Agric. Chem. Environ., 10: 37-56.
- Ologhobo, A.D., 1992. Nutritive values of some tropical (West African) legumes for poultry. J. Appl. Anim. Res., 2: 93-104.
- Köprücü, K. and Y. Özdemir, 2005. Apparent digestibility of selected feed ingredients for Nile tilapia (Oreochromis niloticus). Aquaculture, 250: 308-316.
- Jimoh, W.A., O.A. Fagbenro and E.O. Adeparusi, 2010. Digestibility coefficients of processed jackbean meal Cannavalia ensiformis (L.) DC for Nile tilapia, Oreochromis niloticus (Linnaeus, 1758) diets. Int. J. Fish. Aquacult., 2: 102-107.
- Adeparusi, E.O. and W.A. Jimoh, 2002. Digestibility coefficients of raw and processed lima bean diet for Nile tilapia, Oreochromis niloticus. J. Appl. Aquacult., 12: 89-98.
- Osuigwe, D.I., A.I. Obiekezie and G.C. Onuoha, 2005. Some haematological changes in hybrid catfish (Heterobranchus longifilis x Clarias gariepinus) fed different dietary levels of raw and boiled jackbean (Canavalia ensiformis) seed meal. Afr. J. Biotechnol., 4: 1017-1021.
- Bhagya, B., K.R. Sridhar, S. Seena, C.C. Young and A.B. Arun, 2010. Nutritional evaluation of tender pods of Canavalia maritima of coastal sand dunes. Front. Agric. China, 4: 481-488.
- Gboshe, P.N. and B.A. Ukorebi, 2020. Studies of selected browses of South-Southern part of Nigeria with particular reference to their proximate and some anti-nutritional constituents. Niger. J. Anim. Sci., 22: 322-328.
- Ogunji, J.O., D.I. Osuigwe, O. Okogwu and N. Uwadiegwu, 2008. Response of African catfish, Clarias gariepinus (Burchell, 1822), to diets of pigeon pea, Cajanus cajan, subjected to different processing methods. J. World Aquacult. Soc., 39: 215-224.
- Garcia-Abiado, M.A., G. Mbahinzireki, J. Rinchard, K.J. Lee and K. Dabrowski, 2004. Effect of diets containing gossypol on blood parameters and spleen structure in tilapia, Oreochromis sp., reared in a recirculating system. J. Fish Dis., 27: 359-368.
- Jimoh, W.A., A.A. Ayeloja, F.O. Ajasin, F.Y. Okemakin, S.A. Abdusalami and O.F. Adekunle, 2015. Some haematological and biochemical profile of blood of Nile tilapia (Oreochromis niloticus) fed on diets containing water melon (Citrullus lanatus) seedmeal. Bayero J. Pure Appl. Sci., 8: 109-114.
- Adogu, P.O.U., K.A. Uwakwe, N.B. Egenti, A.P. Okwuoha and I.B. Nkwocha, 2015. Assessment of waste management practices among residents of Owerri Municipal Imo State Nigeria. J. Environ. Prot., 6: 446-456.
- Seena, S., K.R. Sridhar, A.B. Arun and C.C. Young, 2006. Effect of roasting and pressure-cooking on nutritional and protein quality of seeds of mangrove legume Canavalia cathartica from southwest coast of India. J. Food Compos. Anal., 19: 284-293.
- Megbowon, I., H.A. Fashina-Bombata, M.M.A. Akinwale, A.M. Hammed and T.O. Mojekwu, 2014. Growth performance of wild strains of Clarias gariepinus from Nigerian waters. J. Fish. Aquat. Sci., 9: 252-256.
- Charo-Karisa, H., M.A. Opiyo, J.M. Munguti, E. Marijani and L. Nzayisenga, 2013. Cost-benefit analysis and growth effects of pelleted and unpelleted on-farm feed on African catfish (Claries gariepinus Burchell 1822) in earthen ponds. Afr. J. Food Agric. Nutr. Dev., 13: 8019-8033.
- Ezewudo, B.I., C.O. Monebi and A.A.A. Ugwumba, 2015. Production and utilization of Musca domestica maggots in the diet of Oreochromis niloticus (Linnaeus, 1758) fingerlings. Afr. J. Agric. Res., 10: 2363-2371.
How to Cite this paper?
APA-7 Style
Michael,
K.G., Sogbesan,
O.A., Onyia,
L.U. (2023). Growth Performance of Clarias gariepinus Fingerlings Fed Fermented Canavalia ensiformis Seed Meals. Asian Journal of Biological Sciences, 16(1), 71-78. https://doi.org/10.3923/ajbs.2023.71.88
ACS Style
Michael,
K.G.; Sogbesan,
O.A.; Onyia,
L.U. Growth Performance of Clarias gariepinus Fingerlings Fed Fermented Canavalia ensiformis Seed Meals. Asian J. Biol. Sci 2023, 16, 71-78. https://doi.org/10.3923/ajbs.2023.71.88
AMA Style
Michael
KG, Sogbesan
OA, Onyia
LU. Growth Performance of Clarias gariepinus Fingerlings Fed Fermented Canavalia ensiformis Seed Meals. Asian Journal of Biological Sciences. 2023; 16(1): 71-78. https://doi.org/10.3923/ajbs.2023.71.88
Chicago/Turabian Style
Michael, Kesonga, Garduga, O. A. Sogbesan, and L. U. Onyia.
2023. "Growth Performance of Clarias gariepinus Fingerlings Fed Fermented Canavalia ensiformis Seed Meals" Asian Journal of Biological Sciences 16, no. 1: 71-78. https://doi.org/10.3923/ajbs.2023.71.88

This work is licensed under a Creative Commons Attribution 4.0 International License.