Intercropping Some Soybean Genotypes with Corn for Producing Soybean Seeds, Quality and Land Equivalent Ratios
-
Abd El-Alim Abd El-Rhman Metwally
Department of Agronomy, Faculty of Agriculture, Cairo University, Giza, Egypt
Neama Abd El Salheen SalehDepartment of Agronomy, Faculty of Agriculture, Cairo University, Giza, Egypt
Eman Ibrahim Abdel-Wahab

Department Food Legumes Research, Field Crops Research Institute, Agricultural Research Center, Giza, Egypt
Yaser Ahmed Abd El-Halim HefnyDepartment Crop Intensification Research, Field Crops Research Institute, Agricultural Research Center, Giza, Egypt
| Received 15 Mar, 2024 |
Accepted 18 Jul, 2024 |
Published 30 Sep, 2024 |
Background and Objective: Due to the increasing feed costs that have significantly impacted the Egyptian diet by raising the prices of meat products, Egypt needs to boost its production of corn and soybeans. The main objective of the present study was to determine the best-intercropped soybean genotype to enhance productivity, quality and profitability, as well as predict the feeding efficiency for livestock, tilapia and chickens. Materials and Methods: A field experiment was conducted at the Agricultural Experiments and Research Station, Faculty of Agriculture, Cairo University, Giza, Egypt, during the 2022 and 2023 seasons. Twenty different genotypes of soybeans were selected, including US cultivars (Woodworth, Bellatti L263, Columbus, Clark, Crawford, MD 77-5675, Union, DR-101, Forrest, Hill, Holladay and Toano), Chinese genotypes (C7, C14 and C34), Egyptian varieties (Giza 22, Giza 35 and Giza 111) and Korean genotypes (PI 398408 and PI 399035). The experiment was set up in a split-plot design with three replications. The main plots were randomly assigned to solid and intercropping cropping systems, while the subplots were randomized to soybean genotypes. Results: Intercropped soybean leaves received lower light intensity compared to solid planting. Soybean genotypes showed varying responses to intercropping, with some genotypes performing better in terms of plant height, number of branches, seed yield and seed quality under intercropping. Giza 111 and C34 had higher seed yields per plant and per ha than the others under intercropping and solid plantings. Meanwhile, soybean genotypes Woodworth and Dr-101 had higher seed yield per plant and seed index, as well as seed yield per ha than the others under intercropping and solid plantings. Higher seed protein and oleic contents have been recorded in Woodworth, Forrest, Bellatti L263 and Dr-101, meanwhile, Crawford and Giza 111 had higher seed oil content. Meanwhile, Columbus and Hill had higher seed fiber content. Conclusion: Clark, Dr-101, Hill, Holladay, Giza 111 and Woodworth were identified as suitable for the feed industry and demonstrated higher land equivalent ratios (LERs) and economic returns when intercropped with corn. Intercropping Clark, Dr-101, Hill, Holladay, Giza 111 or Woodworth with corn can enhance productivity and profitability for Egyptian farmers.
| Copyright © 2024 Metwally et al. This is an open-access article distributed under the Creative Commons Attribution License, which permits unrestricted use, distribution, and reproduction in any medium, provided the original work is properly cited. |
INTRODUCTION
The Central Agency for Public Mobilization and Statistics reports that 57.8% of Egyptians reside in rural areas, emphasizing the need for rural development for social and economic advancement. Egypt is investing in key projects like the Wahat Bahariya (80 million chicks are raised on an 11000 ha farm), broiler in Qena Governorate (12 million chickens are raised on a 1000 ha farm) and fish farm (Ghalioun pond) projects to boost local production in the Middle Delta, particularly in the Gharbia Governorate, which is a major producer of chickens, ducks and geese. Moreover, El-Sharkia Governorate is known for its cattle and buffalo breeding and trading activities. To meet the nutritional needs of various animal species, high-quality seeds and grains are essential for manufacturing animal feed products. Soybean has emerged as a valuable protein and oil source for ruminants and non-ruminants, with Egypt importing around two million tons annually due to limited cultivation. The global demand for soybean meal in livestock, poultry, waterfowl and fish feed has risen1,2, leading to the use of soybean seeds in concentrated feeds across Africa.
According to researchers3-6, soybean seeds are a valuable source of oil and protein, particularly used in poultry feed. They provide 78.7% of soybean meal and 18.6% of oil, with oil content varying depending on variety and growth conditions. Despite their oil content, soybeans account for nearly 50% of global oil seed production. Commercial soybean seed weight typically ranges from 10-20 g/100 seeds, with the seed index playing a crucial role in yield7,8. Soybean seeds are essential for animal and poultry feed, with dehulled soybean meal having a high protein content9,10. Egyptian laborers and peasants supplement 20-30% of the waterfowl’s diet with soybean seeds or meals to improve meat quality, fattening, egg production and shell strength. Zhu et al.11 found soybean meal has a similar amino acid profile to fishmeal, except for methionine. Fish farming experts recommend 45% protein content for fish diets, including soybean hulls12.
Soybean meal accounts for two-thirds of protein feed production globally13. Mixing soybeans with corn can meet livestock needs9. Tilapia fish can use up to 57.50% corn in their diet14. Corn grain contains 4% oil, 8-12% protein and 70% starch15. Partial substitution doesn’t affect broiler health16. Meyer and Bobeck17 found that soybeans increased broiler weight and extruded corn improved feed intake. With a production per ha of about 3.60 tons, soybean acreage expanded to over 63 thousand ha in 2022, according to Abdel-Wahab et al.18. Intercropping soybeans with corn depends on appropriate soybean varieties and genetic variation. Korean soybean cultivars are promising for improving crop quality and yield19,20. Alternating soybean and corn ridges is an appropriate agricultural system for increasing soybean production without affecting corn density. Intercropping some soybean cultivars with corn is more land-efficient and profitable than corn solid planting21,22. Therefore, the primary goal of this study was to determine the best-intercropped soybean genotype to enhance productivity, quality and profitability, as well as to predict the feeding efficiency of livestock, tilapia and chickens.
MATERIALS AND METHODS
A two-year study was carried out at the Agricultural Experiments and Research Station, Faculty of Agriculture, Cairo University, Giza, Egypt, during the 2022 and 2023 seasons to determine the best intercropped soybean genotype to enhance productivity, quality and profitability, as well as predicting the feeding efficiency for livestock, tilapia and chickens. American varieties Woodworth, Bellatti L263, Columbus, Clark, Crawford, MD 77-5675, Union, DR-101, Forrest, Hill, Holladay and Toano; Chinese genotypes C7, C14 and C34; Egyptian varieties Giza 22, Giza 35 and Giza 111 and Korean genotypes PI 398408 and PI 399035 were among the twenty genotypes of soybeans. These genotypes were selected for this study based on their differences in maturity groups (Table 1).
|
| Table 1: | Maturity groups and origin of the studied soybean genotypes | |||
| Soybean genotypes | Maturity group | Origin | Soybean genotypes | Maturity group | Origin |
| American varieties Woodworth | IIIa | USA | Holladay | Va | USA |
| Bellatti L263 | IVa | USA | Toano | Va | USA |
| Columbus | IVa | USA | Chinese genotypes C 7 | ** | China |
| Clark | IVa | USA | C 14 | ** | China |
| Crawford | IVa | USA | C 34 | ** | China |
| MD 77-5675 | IVa | USA | Egyptian varieties Giza 35 | IIIe | Egypt |
| Union | IVa | USA | Giza 22 | IVe | Egypt |
| DR-101 | Va | USA | Giza 111 | IVe | Egypt |
| Forrest | Va | USA | Korean genotypes PI 398408 | IVa | South Korea |
| Hill | Va | USA | PI 399035 | IVa | South Korea |
| **Entries imported from China, aAmerican classification and eEgyptian classification | |||||
The split-plot design included three replications of each treatment. Cropping strategies (solid and intercropping) were randomly assigned to the main plots and soybean genotypes were randomly assigned to subplots. Each plot area was 11.2 m2 (4 ridges×0.7 m wide×4 m long). Corn was planted on May 31 and 24 in the seasons of 2022 and 2023, respectively, with soybeans seeded a week later. The corn cultivar Cairo 1 was used in this study, provided by the Agronomy Department at Cairo University’s Faculty of Agriculture. The genotypes of American, Chinese and Korean soybeans were generously contributed by the Agronomy Department of Cairo University’s Faculty of Agriculture and the Egyptian soybean varieties were provided by the Food Legumes Research Department, Field Crops Research Institute, ARC, Egypt.
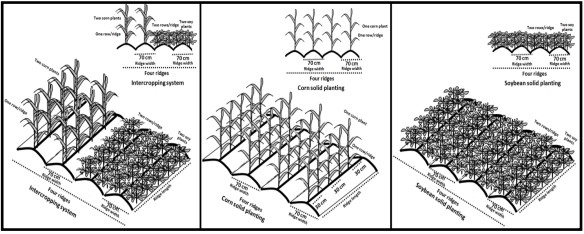
The experiment consisted of forty treatments, which were combinations of two cropping systems with twenty soybean genotypes, along with a solid planting of corn. The experimental soil had a clay loam texture and wheat was the preceding crop two weeks after wheat harvesting. During soil preparation, phosphorus fertilizer was applied at a rate of 357 kg/ha as a single calcium superphosphate (15.5% P2O5). In the intercropping system, two corn plants were planted together at a distance of 40 cm between plants, while in the solid planting, one corn plant was planted at a distance of 30 cm between plants. The soybean was drilled in two rows for each ridge and thinned into two plants at a distance of 20 cm between plants in both the solid and intercropping plantings for all soybean genotypes (Fig. 1).
Furrow irrigation is used in this area for watering crops. The first irrigation was applied 21 days after planting, followed by irrigations every two weeks. Hand hoeing was done before the first and second irrigations, along with any necessary pesticide spraying. Ammonium nitrate, a 33.5% N mineral nitrogen fertilizer, was applied to corn at a rate of 285.6 kg/ha in two equal doses before the first and second irrigations under the two cropping systems. Data on soybean plant attributes were collected from ten plants in each subplot.
Studied traits
Light intensity within soybean canopy: At harvest, ten guarded plants were taken randomly from each plot to estimate the following traits: Light intensity within soybean plants at the middle of the plant (Lux) was recorded on ten plants from each plot by Lux-meter apparatus at 12 hrs and expressed as percentage from light intensity measured above the plant.
Economic yield and its components: At harvest, ten guarded plants were taken randomly from each plot to estimate the following traits: Plant height (cm), number of branches per plant, number of pods per plant and seed yield per plant (g). Seed index (g) was estimated by weighting 100 seeds of each genotype under intercropping and solid plantings. Soybean seed and corn grain yields were recorded on the basis of experimental plots and expressed as tons per ha.
Chemical composition of soybean seeds: The Food Technology Research Institute, ARC provided support for the analysis of the seed’s oil and crude protein contents, in accordance with protocols outlined by AOAC and Horwitz23. The formula for calculating crude protein content was to multiply total N by 5.7124.
Competitive relationships: The land equivalent ratios (LERs)25 and land equivalent coefficient (LEC)26 were calculated using the following formulas:
where, Yaa is the yield of crop a (corn), in a pure stand, Ybb is the yield of crop b (soybean) in a pure stand, Yab is the yield of crop a (corn) in an intercrop and Yba is the yield of crop b (soybean) in an intercrop.
where, RYa is the relative yield of crop a (corn) and RYb is the relative yield of crop b (soybean).
Farmer’s benefit: The farmer’s benefit (USD) was calculated by subtracting the total costs of intercropping from the overall returns, as outlined by Abd El-Alim et al.27. The total returns were determined by multiplying the yields of individual crops by the corresponding Egyptian prices. The net returns of the intercropping system were calculated by subtracting the fixed costs of corn and the variable costs of the two crops.
To assess the productivity and profitability of intercropping compared to solid planting, the monetary advantage index (MAI) was computed using the yields of corn and soybeans.
According to Tripathi28, the MAI formula is:
where, LERs is the Land equivalent ratio
The estimated monetary returns were based on the 2023 Egyptian market prices for soybeans and corn, which were USD 478 and USD 1500/ton, respectively.
Statistical analysis: Analysis of variance of the obtained results of each season was performed. The homogeneity test was conducted of error mean squares and accordingly, the combined analysis of the two experimental seasons was carried out. The measured variables were analyzed by ANOVA using MSTATC statistical package. Mean comparisons were done using Least Significant Differences (LSD) method at 5% level of probability to compare differences between the means29.
RESULTS
Light intensity within soybean canopy
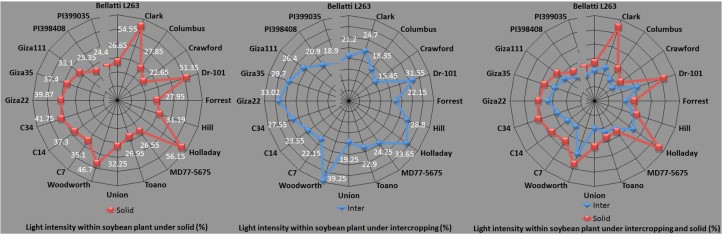
Cropping systems: The effects of cropping systems on light intensity within soybean plants are shown in Fig. 2. Intercropped soybean leaves captured lower light intensity than those of solid planting. Intercropping reduced light intensity within soybean leaves by 28.58% of sunlight compared with the solid soybean.
Soybean genotypes: Overall cropping systems, soybean genotypes have differed for light intensity within soybean leaves (Fig. 2). Leaves of soybean genotypes Holladay, Woodworth, Dr-101 and Clark captured higher light intensity (without significant differences among them) than the others. Meanwhile, the soybean genotypes Giza 22, C 34, Giza 35, C 14 and Giza 111 came in the second rank for this trait.
Interaction between cropping systems and soybean genotypes: The interactions between the cropping systems and soybean genotypes were significant for light intensity within soybean leaves (Fig. 2). The soybean genotypes Bellatti L263, Columbus, Crawford, Forrest, Hill, MD 77-5675, Toano, Giza 22, Giza 35, Giza 111, PI 398408 and PI 399035 did not differ significantly between solid and intercropping plantings for light intensity within soybean leaves.
Economic yield and its components
Cropping systems: Plant height, number of branches and pods per plant, seed yield per plant, 100-seed weight and seed yield per ha were affected significantly by cropping systems, meanwhile, corn grain yield per ha was not affected (Table 2). Intercropping soybean with corn increased plant height as compared to solid soybean. Meanwhile, intercropping soybean with corn decreased the numbers of branches and pods per plant as compared to solid soybean. Intercropping soybean with corn decreased seed yield per plant as compared to solid soybean. With respect to seed index, significant effects of cropping systems on seed index are shown in Table 2. Intercropping soybean with corn decreased the seed index as compared to solid soybean. Intercropping soybean with corn decreased seed yield per ha as compared with solid soybean.
|
| Table 2: | Yield traits of twenty soybean genotypes under intercropping and solid plantings (average of the two seasons) | |||
| Traits | Plant height (cm) |
Branches/plant (No.) |
Pods/plant (No.) |
Seed yield/plant (g) |
Seed index (g) |
Soybean seed yield/ha (ton) |
Corn grain yield/ha (ton) |
||||||||||||||
| Soybean genotypes | Inter | Solid | Mean | Inter | Solid | Mean | Inter | Solid | Mean | Inter | Solid | Mean | Inter | Solid | Mean | Inter | Solid | Mean | Inter | Solid | Mean |
| American genotypes | |||||||||||||||||||||
| Bellatti L263 | 127.83 | 71.73 | 99.78 | 3.33 | 5.57 | 4.45 | 35.45 | 69.19 | 52.32 | 12.56 | 22.07 | 17.31 | 13.26 | 14.17 | 13.71 | 1.33 | 3.45 | 2.39 | 6.72 | 6.94 | 6.83 |
| Clark | 106.63 | 82.41 | 94.52 | 1.81 | 3.12 | 2.46 | 27.52 | 34.47 | 30.99 | 8.34 | 12.12 | 10.23 | 8.81 | 13.02 | 10.91 | 1.47 | 3.15 | 2.31 | 6.81 | 6.94 | 6.87 |
| Columbus | 123.22 | 76.78 | 100 | 3.27 | 6.18 | 4.72 | 30.36 | 56.75 | 43.55 | 9.93 | 12.66 | 11.29 | 8.09 | 12.42 | 10.25 | 1.29 | 2.88 | 2.08 | 6.63 | 6.94 | 6.78 |
| Crawford | 98.97 | 79.05 | 89.01 | 2.31 | 4.23 | 3.27 | 52.34 | 72.53 | 62.43 | 10.63 | 18.75 | 14.69 | 17.81 | 22.63 | 20.22 | 1.42 | 3.28 | 2.35 | 6.92 | 6.94 | 6.93 |
| Dr-101 | 84.39 | 70.63 | 77.51 | 4.55 | 6.04 | 5.29 | 49.89 | 77.08 | 63.48 | 19.01 | 21.8 | 20.4 | 19.32 | 22.08 | 20.7 | 2.01 | 2.88 | 2.44 | 6.66 | 6.94 | 6.8 |
| Forrest | 96.11 | 77.09 | 86.6 | 1.93 | 3.58 | 2.75 | 26.68 | 36.73 | 31.7 | 8.24 | 16.96 | 12.6 | 16.04 | 17.85 | 16.94 | 1.4 | 2.96 | 2.18 | 6.79 | 6.94 | 6.86 |
| Hill | 129.56 | 83.07 | 106.31 | 1.03 | 3.64 | 2.33 | 30.95 | 63.64 | 47.29 | 16.02 | 25.71 | 20.86 | 19.01 | 21.2 | 20.1 | 1.77 | 2.9 | 2.33 | 6.83 | 6.94 | 6.88 |
| Holladay | 107.56 | 90.28 | 98.92 | 2.32 | 3.52 | 2.92 | 48.31 | 57.08 | 52.69 | 16.78 | 23.79 | 20.28 | 13.5 | 22.14 | 17.82 | 1.63 | 3.41 | 2.52 | 6.74 | 6.94 | 6.84 |
| MD 77-5675 | 97.96 | 73.44 | 85.7 | 1.98 | 3.93 | 2.95 | 32.64 | 41.89 | 37.26 | 11.57 | 17.67 | 14.62 | 6.87 | 13.1 | 9.98 | 1.16 | 3.04 | 2.1 | 6.69 | 6.94 | 6.81 |
| Toano | 91.78 | 64.25 | 78.01 | 2.75 | 3.86 | 3.3 | 28.68 | 42.03 | 35.35 | 11.95 | 17.72 | 14.83 | 16.56 | 19.13 | 17.84 | 1.35 | 3.33 | 2.34 | 6.74 | 6.94 | 6.84 |
| Union | 85.78 | 59.82 | 72.8 | 1.46 | 2.37 | 1.91 | 16.21 | 31.13 | 23.67 | 9.12 | 15.88 | 12.5 | 15.09 | 19.09 | 17.09 | 0.89 | 2.83 | 1.86 | 6.9 | 6.94 | 6.92 |
| Woodworth | 103.78 | 93.23 | 98.5 | 3.02 | 4.77 | 3.89 | 47.87 | 69.07 | 58.47 | 19.34 | 26.05 | 22.69 | 22.88 | 24.55 | 23.71 | 2.04 | 2.67 | 2.35 | 6.82 | 6.94 | 6.88 |
| Chinese genotypes | |||||||||||||||||||||
| C 7 | 143.11 | 96.29 | 119.7 | 2.04 | 5.21 | 3.62 | 16.37 | 28.85 | 22.61 | 7.54 | 10.09 | 8.81 | 12.35 | 14.54 | 13.44 | 1.13 | 2.98 | 2.05 | 6.91 | 6.94 | 6.92 |
| C 14 | 157.82 | 101.77 | 129.79 | 1.43 | 4.38 | 2.9 | 28.63 | 62.93 | 45.78 | 7.87 | 15.42 | 11.64 | 7.82 | 9.47 | 8.64 | 1.09 | 2.65 | 1.87 | 6.79 | 6.94 | 6.86 |
| C 34 | 100.62 | 80.25 | 90.43 | 3.96 | 5.89 | 4.92 | 36.52 | 49.97 | 43.24 | 16.57 | 24.43 | 20.5 | 13.66 | 15.75 | 14.7 | 1.81 | 2.89 | 2.35 | 6.9 | 6.94 | 6.92 |
| Egyptian cultivars | |||||||||||||||||||||
| Giza 22 | 110.37 | 84.84 | 97.6 | 3.87 | 6.72 | 5.29 | 41.43 | 54.62 | 48.02 | 15.31 | 21.09 | 18.2 | 16.86 | 18.51 | 17.68 | 1.66 | 3.41 | 2.53 | 6.86 | 6.94 | 6.9 |
| Giza 35 | 91.67 | 72.15 | 81.91 | 2.48 | 4.04 | 3.26 | 40.37 | 51.63 | 46 | 14.79 | 20.23 | 17.51 | 15.71 | 16.67 | 16.19 | 1.24 | 3.04 | 2.14 | 6.67 | 6.94 | 6.8 |
| Giza 111 | 127.54 | 102.75 | 115.14 | 3.92 | 6.56 | 5.24 | 43.94 | 62.38 | 53.16 | 19.62 | 26.25 | 22.93 | 17.31 | 21.56 | 19.43 | 1.44 | 3.24 | 2.34 | 6.73 | 6.94 | 6.83 |
| Korean genotypes | |||||||||||||||||||||
| PI 398408 | 140.83 | 108.82 | 124.82 | 1.41 | 5.19 | 3.3 | 16.73 | 31.31 | 24.02 | 6.75 | 10.57 | 8.66 | 7.73 | 11.03 | 9.38 | 0.8 | 2.12 | 1.46 | 6.84 | 6.94 | 6.89 |
| PI 399035 | 136.63 | 99.76 | 118.19 | 1.48 | 4.73 | 3.1 | 19.12 | 34.68 | 26.9 | 5.48 | 9.88 | 7.68 | 6.31 | 7.35 | 6.83 | 0.93 | 2.47 | 1.7 | 6.92 | 6.94 | 6.93 |
| Mean | 113.1 | 83.42 | 98.26 | 2.51 | 4.67 | 3.59 | 33.5 | 51.39 | 42.44 | 12.37 | 18.45 | 15.41 | 13.75 | 16.81 | 15.28 | 1.39 | 2.97 | 2.18 | 6.79 | 6.94 | 6.86 |
| F-test 0.05 cropping systems | ** | ** | ** | ** | ** | ** | NS | ||||||||||||||
| LSD 0.05 soybean genotypes | 14.74 | 1.16 | 11.23 | 2.66 | 1.17 | 1.12 | NS | ||||||||||||||
| LSD 0.05 interaction | 22.39 | 1.83 | 15.05 | 3.82 | 2.02 | 1.77 | NS | ||||||||||||||
Soybean genotypes: Overall cropping systems, soybean genotypes differed for plant height, number of branches and pods per plant, seed yield per plant, 100-seed weight and seed yield per ha, meanwhile, corn grain yield per ha was not affected (Table 2). Soybean genotypes C14, PI 398408, C7, PI 399035 and Giza 111 were taller plants than the others. Meanwhile, soybean genotypes Hill, Columbus, Bellatti L263, Holladay, Woodworth, Giza 22, Clark, C34, Crawford, Forrest and MD 77-5675 ranked as the second class. Conversely, soybean genotypes Union, Dr-101, Toano and Giza 35 were shorter ones. Also, soybean genotypes Giza 22, Dr-101, Giza 111, C34, Bellatti L263 and Columbus recorded a higher number of branches than the other genotypes (Table 2).
Meanwhile, the converse was true for soybean genotypes Union, Hill, Clark, Forrest, C14, Holladay and MD 77-5675. Moreover, soybean genotypes Dr-101, Crawford, Woodworth, Giza 111, Holladay and Bellatti L263 had a higher number of pods per plant than the others (Table 2). Meanwhile, the converse was true for soybean genotypes Union, C7, PI 398408, PI 399035, Clark and Forrest. With respect to seed yield per plant, soybean genotypes Woodworth, Giza 111, Dr-101, Hill, C34 and Holladay recorded higher seed yield per plant (without any significant differences among them) than the others (Table 2). Soybean genotypes Giza 22, Giza 35 and Bellatti L263 came in the second rank. Conversely, PI 399035, PI 398408 and C7 recorded lower values of this trait than the others. With regard to seed index, soybean genotypes differed significantly for seed index (Table 2). The soybean genotype Woodworth was superior in seed index, followed by Dr-101, Crawford, Hill and Giza 111 (without any significant differences among them) than the others. On the other hand, the soybean genotype PI 399035 recorded the lowest seed index compared with the others. With regard to seed yield/ha, soybean genotypes significantly differed for this trait, meanwhile, corn grain yield/ha was not affected. Higher seed yield/ha have been recorded in soybean genotypes Giza 22, Holladay, Dr-101, Bellatti L263, Crawford, Woodworth, C34, Giza 111, Toano, Hill, Clark, Forrest, Giza 35, MD 77-5675 and Columbus without any significant differences among them.
Interaction between cropping systems and soybean genotypes: The interactions between the cropping systems and soybean genotypes were significant in for plant height, number of branches and pods per plant, seed yield per plant, 100-seed weight and seed yield per ha, meanwhile, corn grain yield per ha was not affected (Table 2). Soybean genotypes C14, C7, PI 398408 and PI 399035 were the tallest plants as compared with the others under intercropping and solid plantings. Meanwhile, soybean genotypes Union, Toano, Dr-101, Bellatti L263, Giza 35, MD 77-5675, Columbus, Forrest, Crawford, C34 and Clark had the opposite trend. It is important to mention that the plant height of soybean genotypes Giza 35, C34, Woodworth, Forrest, Dr-101 and Crawford was not affected by intercropping. Soybean genotypes Dr-101, C34, Giza 111, Giza 22, Bellatti L263, Columbus, Woodworth and Toano had a higher number of branches per plant than the others under intercropping and solid plantings. Meanwhile, soybean genotypes Hill, PI 398408, C14, Union, PI 399035, Clark, Forrest, MD 77-5675, C7, Crawford, Holladay, Giza 35 and Toano had the opposite trend. It is important to mention that the number of branches of soybean genotypes Union, Toano, Holladay, Forrest, Dr-101 and Clark was not affected by intercropping. Soybean genotypes Crawford, Dr-101, Holladay, Woodworth, Giza 111, Giza 22 and Giza 35 had a higher number of pods per plant than the others under intercropping and solid plantings. Meanwhile, soybean genotypes Union, C7, PI 398408, PI 399035, Forrest, Clark, C14, Toano, Columbus and Hill had the opposite trend.
It is important to mention that number of pods of soybean genotypes Clark, Forrest, Holladay, MD 77-5675, Toano, Union, C7, C34, Giza 22, Giza 35 and PI 398408 was not affected by intercropping. Soybean genotypes Giza 111, Woodworth, Dr-101, Holladay, C34 and Hill had higher seed yields per plant than the others under intercropping and solid plantings. Meanwhile, soybean genotypes Giza 111, Woodworth and Holladay had the opposite trend. It is worth noting that seed yields of soybean genotypes Clark, Columbus, Dr-101 and C7 were not affected significantly by intercropping. With respect to seed index, the soybean cultivars Crawford, Dr-101, Hill and Woodworth had higher seed index than the others under intercropping and solid plantings. Seed index of soybean genotypes Bellatti L263, Forrest, Woodworth, C14, Giza 22, Giza 35 and PI 399035 was not affected significantly by intercropping. It is clear that seed index of the soybean cultivars Bellatti L263, Forrest and Woodworth are not affected by intercropping. Meanwhile, seed index of the soybean genotypes C14, Giza 22, Giza 35 and PI 399035 was not affected significantly by intercropping.
With respect to seed yield/ha, the soybean cultivars Woodworth, Dr-101, C34, Hill, Giza 22, Holladay, Clark and Giza 111 had higher seed yield/ha than the others under solid and intercropping plantings. Seed yield/ha of soybean genotypes Columbus, DR-101, Forrest, Hill, Woodworth, C14, C34, Giza 22, PI 398408 and PI 399035 were not affected significantly by intercropping. It is clear that seed yield/ha of the soybean cultivars Dr-101, Forrest and Woodworth are not affected by intercropping. Seed yield/ha of soybean genotypes Columbus, Hill, C14, C34, Giza 22, PI 398408 and PI 399035 were not affected significantly by intercropping.
Chemical composition of soybean seeds: This section aimed to present a screening of twenty soybean genotypes under solid and intercropping plantings, to evaluate the composition of seed with regard to the protein, oil, oleic acid and fiber contents.
Cropping systems: Cropping systems did not affect significantly seed protein and oil contents (Table 3). Conversely, intercropping had lower seed oleic and fiber contents than solid soybean as compared with solid soybean.
| Table 3: | Seed chemical constituents of twenty soybean genotypes under intercropping and solid plantings (average of the two seasons) | |||
| Seed protein content (%) |
Seed oil content (%) |
Seed oleic content (fatty acids (%)) |
Seed fiber content (%) |
|||||||||
| Traits Soybean genotypes |
Inter | Solid | Mean | Inter | Solid | Mean | Inter | Solid | Mean | Inter | Solid | Mean |
| American genotypes | ||||||||||||
| Bellatti L263 | 46.25 | 45.1 | 45.67 | 19.71 | 20.55 | 20.13 | 21.87 | 22.86 | 22.36 | 7.83 | 8.06 | 7.94 |
| Clark | 44.96 | 43.74 | 44.35 | 21.6 | 20.37 | 20.98 | 21.81 | 22.03 | 21.92 | 8.9 | 9.22 | 9.06 |
| Columbus | 38.73 | 37.8 | 38.26 | 22.46 | 23.61 | 23.03 | 19.9 | 20.53 | 20.21 | 9.45 | 9.71 | 9.58 |
| Crawford | 40.89 | 42.02 | 41.45 | 20.53 | 21.23 | 20.88 | 20.23 | 20.82 | 20.52 | 8.26 | 8.58 | 8.42 |
| Dr-101 | 45.55 | 43.9 | 44.72 | 21.68 | 20.39 | 21.03 | 21.85 | 22.2 | 22.02 | 8.98 | 9.24 | 9.11 |
| Forrest | 46.68 | 45.23 | 45.95 | 19.58 | 20.4 | 19.99 | 21.92 | 23.09 | 22.5 | 7.8 | 8.09 | 7.94 |
| Hill | 38.88 | 37.49 | 38.18 | 22.3 | 23.74 | 23.02 | 19.98 | 20.6 | 20.29 | 9.28 | 9.6 | 9.44 |
| Holladay | 41.09 | 39.22 | 40.15 | 21.44 | 22.21 | 21.82 | 20.15 | 20.78 | 20.46 | 8.84 | 9.11 | 8.97 |
| MD 77-5675 | 39.32 | 37.97 | 38.64 | 21.85 | 22.96 | 22.4 | 19.98 | 20.66 | 20.32 | 9.1 | 9.44 | 9.27 |
| Toano | 39.31 | 38.54 | 38.92 | 21.34 | 22.69 | 22.01 | 20.1 | 20.58 | 20.34 | 8.77 | 9.01 | 8.89 |
| Union | 38.65 | 37.51 | 38.08 | 22.02 | 23.53 | 22.77 | 20.09 | 20.55 | 20.32 | 9.04 | 9.35 | 9.19 |
| Woodworth | 46.63 | 45.54 | 46.08 | 18.8 | 20.17 | 19.48 | 21.86 | 23.33 | 22.59 | 7.22 | 7.6 | 7.41 |
| Chinese genotypes | ||||||||||||
| C 7 | 37.7 | 36.22 | 36.96 | 17.12 | 17.89 | 17.5 | 18.24 | 18.63 | 18.43 | 7.47 | 7.81 | 7.64 |
| C 14 | 38.09 | 36.87 | 37.48 | 16.72 | 17.63 | 17.17 | 18.43 | 18.88 | 18.65 | 7.32 | 7.68 | 7.5 |
| C 34 | 38.43 | 37.26 | 37.84 | 16.37 | 17.07 | 16.72 | 18.58 | 18.9 | 18.74 | 7.34 | 7.68 | 7.51 |
| Egyptian varieties | ||||||||||||
| Giza 22 | 39.76 | 38.16 | 38.96 | 21.53 | 22.88 | 22.2 | 20.34 | 20.82 | 20.58 | 8.93 | 9.2 | 9.06 |
| Giza 35 | 41.47 | 40.02 | 40.74 | 18.71 | 20.06 | 19.38 | 21.72 | 22.08 | 21.9 | 7.44 | 7.8 | 7.62 |
| Giza 111 | 40.3 | 39.68 | 39.99 | 19.37 | 20.92 | 20.14 | 21.2 | 21.65 | 21.42 | 7.95 | 8.28 | 8.11 |
| Korean genotypes | ||||||||||||
| PI 398408 | 37.38 | 36.62 | 37 | 16.33 | 17.09 | 16.71 | 18.03 | 18.29 | 18.16 | 7.2 | 7.51 | 7.35 |
| PI 399035 | 37.9 | 36.99 | 37.44 | 16.38 | 17.46 | 16.92 | 18.05 | 18.36 | 18.2 | 7.27 | 7.55 | 7.41 |
| Mean | 40.89 | 39.79 | 40.34 | 18.97 | 19.78 | 19.38 | 20.21 | 20.78 | 20.49 | 7.85 | 8.15 | 8 |
| F-test 0.05 cropping systems | NS | NS | * | * | ||||||||
| LSD 0.05 soybean genotypes | 4.14 | 3.01 | 0.43 | 0.24 | ||||||||
| LSD 0.05 interaction | NS | NS | NS | NS | ||||||||
| **Significance at a level of 1% of probability (p<0.01), *Significance at a level of 5% of probability (0.01≤p<0.05) and NS: Non-Significance (p≥0.05) | ||||||||||||
Soybean genotypes: Overall cropping systems, soybean genotypes significantly differed for seed protein, oil, oleic and fiber contents (Table 3). Higher seed protein content has been recorded in soybean genotypes Woodworth, Forrest, Bellatti L263, Dr-101 and Clark without any significant differences among them. Conversely, lower seed protein content has been recorded in soybean genotypes C7, PI 398408, PI 399035, C14, C34, Union, Hill, Columbus, MD 77-5675, Toano, Giza 22, Giza 111, Holladay and Giza 35. With respect to seed oil content, higher seed oil content has been recorded in soybean genotypes Columbus, Hill, Union, MD 77-5675, Holladay, Crawford, Giza 111 and Bellatti L263 without any significant differences among them.
Meanwhile, soybean genotypes PI 398408, C34, PI 399035, C14, C7, Giza 35 and Woodworth recorded the lowest values of seed oil content as compared with the others. With respect to seed oleic content, higher seed oleic content has been recorded in soybean genotypes Forrest, Woodworth, Bellatti L263, Clark and Giza 35 without any significant differences among them. Meanwhile, Asian soybean genotypes (Chinese; i.e., C7, C14 and C34 and Korean; i.e., PI 398408 and PI 399035) had lower seed oleic content than the others. With respect to seed fiber content, higher seed fiber content has been recorded in soybean genotypes Columbus and Hill without any significant differences between them. Soybean genotypes MD 77-5675, Union, Dr-101, Clark and Giza 22 came in the second rank. Meanwhile, soybean genotypes PI 398408, PI 399035, Woodworth, C14 and C34 recorded the lowest values of seed fiber content as compared with the others.
Interaction between cropping systems and soybean genotypes: The interactions between the cropping systems and soybean genotypes had insignificant effects on seed protein, oil, oleic and fiber contents (Table 3). These data show that each of these two factors act independently on seed protein, oil, oleic and fiber contents.
Competitive relationships: Soybean genotypes were affected significantly for RY soybean, LERs and LEC, meanwhile RY corn was not affected (Table 4).
These results indicate that intercropping soybean genotypes Woodworth and Dr-101 with corn were superior for RY soybean, LERs and LEC. Intercropping soybean genotypes C34 or Hill with corn came in the second rank. Conversely, intercropping soybean genotypes Union, PI 398408, PI 399035, Bellatti L263, MD 77-5675 or C7 with corn recorded lower values of RY soybean, LERs and LEC.
Farmer’s benefit: Soybean varieties have differed significantly for soybean income, total return and MAI, meanwhile corn income was not affected (Table 4). Intercropping soybean genotypes Woodworth, Dr-101, C34, Hill, Giza 22, Holladay, Clark, or Giza 111 with corn had the highest soybean income, without any significant differences between them, as compared with the others. With respect to total and net returns, it was higher for intercrops than solid plantings of both crops. Intercropping increased total return as compared with solid plantings of corn and soybean, respectively (Table 4).
With respect to total return, intercropping soybean genotypes Woodworth, Dr-101, C34, Hill, Giza 22, Holladay, Crawford, Clark, Giza 111 or Forrest with corn had the highest total return, without any significant differences among them, as compared with the others. Meanwhile, the converse was true by intercropping soybean genotypes PI 398408, Union, PI 399035, C14, MD 77-5675, Giza 35 or C7 with corn. With respect to net return, it was higher for intercrops than solid plantings of both crops. Intercropping increased net return as compared with solid plantings of corn and soybean, respectively (Table 4).
| Table 4: | Competitive relationships and economic returns of twenty soybean genotypes under intercropping and solid plantings (average of the two seasons) | |||
| Competitive relationships | Economic returns (USD/ha) | ||||||||
| Traits Soybean genotypes |
Ry soybean | Ry corn | LERs | LEC | Corn | Soybean | Total | Net | MAI |
| American genotypes | |||||||||
| Bellatti L263 | 0.38 | 0.96 | 1.34 | 0.37 | 3212.16 | 1995 | 5207.16 | 4074.47 | 1321.22 |
| Clark | 0.46 | 0.98 | 1.44 | 0.45 | 3255.18 | 2205 | 5460.18 | 4327.49 | 1668.38 |
| Columbus | 0.44 | 0.95 | 1.39 | 0.42 | 3169.14 | 1935 | 5104.14 | 3971.45 | 1432.09 |
| Crawford | 0.43 | 0.99 | 1.42 | 0.43 | 3307.76 | 2130 | 5437.76 | 4305.07 | 1608.35 |
| Dr-101 | 0.69 | 0.95 | 1.64 | 0.66 | 3183.48 | 3015 | 6198.48 | 5065.79 | 2418.91 |
| Forrest | 0.47 | 0.97 | 1.44 | 0.46 | 3245.62 | 2100 | 5345.62 | 4212.93 | 1633.38 |
| Hill | 0.61 | 0.98 | 1.59 | 0.6 | 3264.74 | 2655 | 5919.74 | 4787.05 | 2196.63 |
| Holladay | 0.47 | 0.97 | 1.44 | 0.46 | 3221.72 | 2445 | 5666.72 | 4534.03 | 1731.49 |
| MD 77-5675 | 0.38 | 0.96 | 1.34 | 0.36 | 3197.82 | 1740 | 4937.82 | 3805.13 | 1252.88 |
| Toano | 0.4 | 0.97 | 1.37 | 0.39 | 3221.72 | 2025 | 5246.72 | 4114.03 | 1416.99 |
| Union | 0.31 | 0.99 | 1.3 | 0.31 | 3298.2 | 1335 | 4633.2 | 3500.51 | 1069.2 |
| Woodworth | 0.76 | 0.98 | 1.74 | 0.75 | 3259.96 | 3060 | 6319.96 | 5187.27 | 2687.79 |
| Chinese genotypes | |||||||||
| C 7 | 0.38 | 0.99 | 1.37 | 0.37 | 3302.98 | 1695 | 4997.98 | 3865.29 | 1349.81 |
| C 14 | 0.41 | 0.97 | 1.38 | 0.39 | 3245.62 | 1635 | 4880.62 | 3747.93 | 1343.93 |
| C 34 | 0.62 | 0.99 | 1.61 | 0.61 | 3298.2 | 2715 | 6013.2 | 4880.51 | 2278.29 |
| Egyptian varieties | |||||||||
| Giza 22 | 0.48 | 0.98 | 1.46 | 0.48 | 3279.08 | 2490 | 5769.08 | 4636.39 | 1817.65 |
| Giza 35 | 0.41 | 0.96 | 1.37 | 0.39 | 3188.26 | 1860 | 5048.26 | 3915.57 | 1363.39 |
| Giza 111 | 0.44 | 0.96 | 1.4 | 0.43 | 3216.94 | 2160 | 5376.94 | 4244.25 | 1536.26 |
| Korean genotypes | |||||||||
| PI 398408 | 0.37 | 0.98 | 1.35 | 0.37 | 3269.52 | 1200 | 4469.52 | 3336.83 | 1158.76 |
| PI 399035 | 0.37 | 0.99 | 1.36 | 0.37 | 3307.76 | 1395 | 4702.76 | 3570.07 | 1244.84 |
| Average of intercropping | 0.46 | 0.97 | 1.43 | 0.45 | 3247.29 | 2089.5 | 5336.79 | 4204.1 | 1626.51 |
| LSD 0.05 | 0.12 | NS | 0.13 | 0.12 | NS | 613.28 | 979.23 | 976.52 | 747.07 |
| Solid planting of corn | 1 | 1 | 1 | 1 | 3317.32 | --- | 3317.32 | 3239.25 | --- |
| Solid planting of soybean | 1 | 1 | 1 | 1 | --- | 4455 | 4455 | 2807.51 | --- |
| Solid planting of corn: 6.86 and 7.02 ton/ha in the first and second seasons, respectively, Solid planting of soybean was estimated by average of seed yield of 20 soybean genotypes/ha (ton) and Egyptian prices of corn and soybean were USD 478 and 1500/ton, respectively | |||||||||
Intercropping soybean genotypes Woodworth, Dr-101, C34, Hill, Giza 22, Holladay, Crawford, Clark, Giza 111, or Forrest with corn had the highest net return, without any significant differences among them, as compared with the others. Meanwhile, the converse was true for intercropping soybean genotypes PI 398408, Union, PI 399035, C14, MD 77-5675, Giza 35, C7, or Columbus with corn. With respect to MAI, it was positive for all intercropped soybean genotypes with corn. Intercropping soybean genotypes Woodworth, Dr-101, C34, Hill, Giza 22, Holladay, Clark, Forrest, Crawford, or Giza 111 with corn had the highest MAI, without any significant differences among them, as compared with the others (Table 4). The converse was true by intercropping soybean genotypes Union, PI 398408, MD 77-5675, PI 399035, Bellatti L263, Giza 35, C14, C7, Toano, or Columbus with corn.
DISCUSSION
With regard to cropping systems, the observed outcomes may be attributed to elevated levels of specific phytohormones in intercropped soybean plants as a consequence of corn’s shading effect. It is possible that the corn plants, which reflect a low penetration of sunlight from the top to the bottom of the soybean plant, increase the soybean plant’s ability to self-shade and cause it to grow taller. One of the essential environmental elements that significantly affects both the canopy’s spatial organization and the photosynthetic activity in leaves is light30.
With respect to soybean genotypes, the investigated genotypes’ genetic potential resulted in the development of several plant parts, including an internode, a trifoliate leaf and the corresponding reproductive branch that was born at the node in question. These findings show that the soybean genotypes Holladay, Woodworth, Dr-101 and Clark can receive more solar radiation than the other genotypes due to their compatibility with corn’s canopy. Plant morphology is recognized to be a complex characteristic influenced by both environmental and genetic causes.
Different responses of tested genotypes to temperature and photoperiod under Egyptian conditions will be indicative of these canopies. Therefore, compared to the other genotypes, the specific soybean genotypes Holladay, Woodworth, Dr-101 and Clark absorbed more solar radiation. It is well known that indeterminate soybean genotypes can continue to develop after blooming, resulting in longer stems and more leaves, which decreases the amount of solar radiation that reaches the plant more than determinate genotypes. These findings were consistent with those of Hussain et al.31, who demonstrated how different soybean cultivars responded to shade.
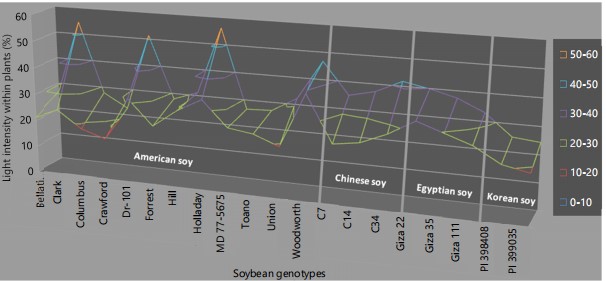
With regard to the interaction between cropping systems and soybean genotypes, the self-shading of soybean genotypes Bellatti L263, Columbus, Crawford, Forrest, Hill, MD 77-5675, Toano, Giza 22, Giza 35, Giza 111, PI 398408 and PI 399035 provided compatible responses with light intensity under intercropping, as demonstrated in Fig. 3.
Under intercropping, the genetic characteristics of Bellatti L263, Columbus, Crawford, Forrest, Hill, MD 77-5675, Toano, Giza 22, Giza 35, Giza 111, PI 398408 and PI 399035 enable them to adapt to low light conditions by adjusting their canopies. These specific genotypes demonstrate a capacity to modify their canopy structure to optimize solar radiation absorption during growth stages. Under intercropping, soybean varieties such as Bellatti L263, Forrest, Hill, MD 77-5675, Toano, PI 398408 and PI 399035 can capture 20-30% more solar radiation compared to other genotypes.
These genotypes may have been developed in cool seasons similar to those of intercropping, leading to their outcomes. Intercropping enabled Egyptian cultivars to capture 20-40% of the sun’s rays with their canopy. In contrast, only 10-30% of solar energy reached the canopy of soybean cultivars Columbus and Crawford. This difference is likely due to the dense canopies of soybean cultivars Columbus and Crawford, which have high leaf area indices. Increasing the leaf area index is a known mechanism for improving light capture efficiency, as supported by Teiz and Zeiger32. These findings aligned with the study by Metwally et al.33, which showed that certain genotypes can adjust their morphological and physiological traits in response to intercropping.
|
With regard to the effect of cropping systems on seed yield and yield components, Increased internode elongation may contribute to the increase in plant height observed in intercropping. Additionally, insufficient absorption and redistribution of nutrients among plant organs can lead to reduced branch and pod formation in intercropped plants. Light availability plays a crucial role in seed filling and pod development. In intercropping, there is a lower transfer of dry matter from leaves to seeds, resulting in fewer pods and reduced seed output per plant. These findings were consistent with those of Metwally et al.33, who found that, in comparison to solid soybean, intercropping soybean with corn reduced the amount of seed produced per plant. The drop in seed index under intercropping can be explained by the fact that the photosynthetic rates in soybean leaves are substantially lower than those in solid soybean. The findings of Metwally et al.22,34, which demonstrated that intercropped soybean produced a lower seed yield than soybean with solid plantings provide credence to these results.
Seed yield per ha under intercropping has decreased as a result of yield components reflecting the lower light intensity received by the canopies of intercropped soybeans compared to solid plants. These findings were consistent with those of Metwally et al.34,35, who demonstrated that solid plantings yielded a higher seed yield per unit area than intercropping.
With respect to soybean genotypes, the differences in soybean genotypes can be attributed to the unique growth and development constraints imposed by their genetic makeup. These limitations result in varying rates of photosynthetic material translocation to the pods. These results are in parallel with those obtained by Metwally et al.33, who found that Giza 111, C1, Woodworth and C34 gave higher seed yields than others. The canopy structure of Giza 111 is characterized by broad leaves34, which have increased light interception. According to Abdel-Wahab et al.36, soybean varieties Dr-101 and Crawford produced higher 100-seed weight without any significant differences between them than the others. They added that soybean variety Dr-101 is characterized by the longest period from stem elongation to pollination and until seed filling compared with others. Meanwhile, Crawford is characterized by the highest total leaf chlorophyll content than leaves of other genotypes37 which affect positively dry matter accumulation during growth and development. Regard to Woodworth, is characterized by early maturity, high total chlorophyll content in leaves and short roots33, which led to enhancing the translocation rate of photosynthates to seeds during its filling.
With regard to the interactions between the cropping systems and soybean genotypes, it appears that high temperatures during intercropping and solid plantings have a significant negative impact on the growth and development of Chinese or Korean soybean genotypes. Regarding the soybean cultivar MD 77-5675, it is likely that this genotype was generated in a climate that was colder and that was adversely impacted by high temperatures during intercropping and solid plantings.
With regard to seed yield per ha, the results may be due to differences in the genetic makeup of the studied genotypes being responsible for the canopy structure indicating different rates of dry matter accumulation. Soybean genotypes Dr-101, Forrest, Hill, Holladay and Toano are late-maturing genotypes (Table 1). So, it may be possible that redistribution from pods to seeds functions as a prolongation of the seed-filling period contributing significant amounts of dry matter to the final yield. It is expected that soybean genotypes Crawford and Giza 111 that had higher seed index than the others reflected positively on the final yield. Meanwhile, the high light intensity within soybean plants (Fig. 2 and 3) significantly increased the final yield of soybean genotypes Clark, Giza 22 and C34.
Although the soybean genotype Woodworth is an early-maturing cultivar (Table 1), it was superior in seed index. These results were due to higher light intensity within soybean plants (Fig. 2 and 3), which reflected positively on the total N-content during growth and development. Thus, it is expected that the total N-content in roots, stems and leaves will drop slightly, which increases the seed’s dry weight during seed development. Moreover, the shading of soybean cultivars Bellatti L263, MD 77-5675 and Columbus represents much denser and less equally spaced plant populations, which decreases the yield per plant but does not necessarily suppress the yield per unit area38. These results were in good line with Abd El-Alim et al.27, who reported that soybean genotypes Giza 111, Giza 83, Crawford, Corsoy 79, Woodworth Black, C 17 and C 24 recorded higher seed yield per ha than the others. They added that these cultivars were able to utilize the available environmental resources more than the others Soybean cultivars C7, C14, Union, PI 399035 and PI 398408 had negative reaction to the hot temperature under Egyptian conditions.
In unfavorable circumstances, Clark, Columbus, Dr-101 and C7 can compensate for their production deficit by increasing the branch setting rate39. Because intercropping allows their canopies to receive more solar radiation, the soybean varieties Clark and Dr-101 are likely more tolerant to it (Fig. 2 and 3). In reference to Columbus, this variety most likely possesses a dense canopy (high leaf area index) to offset the effects of self-shading and corn shading in order to sustain photosynthetic activity. As a result, the leaf area index under shading increases as the total leaf area increases with an increase in the number of leaves40. Reduction of root extension within soil depth with an increased number of branches per plant may be responsible for the C7 soybean genotype’s tolerance to corn shading effects. According to Metwally et al.33, different genotypes of soybeans responded differently to cropping systems in terms of seed output per plant. These results were consistent with their findings.
The dry weights of all reproductive organs were raised by the light enrichment in the canopies of soybean cultivars Dr-101, Hill and Woodworth (Fig. 2 and 3), which is responsible for their high seed index. The Crawford soybean cultivar’s high seed index could be attributed to its exceptional ability to accumulate dry matter by making the most of low light levels (Fig. 3). The results demonstrate that intercropping has no effect on the seed index of the soybean cultivars Bellatti L263, Forrest and Woodworth. Because the soybean cultivar Forrest was resistant to nematodes, which had an impact on the accumulation of dry matter during growth and development, it was able to withstand intercropping41. Conversely, the soybean cultivars Woodworth and Bellatti L263 were able to withstand intercropping because their leaves had a high level of chlorophyll33. Higher dry matter buildup throughout growth and development was the result of this.
In the meantime, intercropping had no discernible impact on the seed index of the soybean genotypes C14, Giza 22, Giza 35 and PI 399035. The narrow leaves of the soybean cultivar Giza 22 enhanced the number of reproductive sinks under intercropping and the availability of light34,42. The soybean cultivar Giza 35, on the other hand, was able to withstand all of the tested insect attacks under intercropping37 because of its canopy structure, which allowed more sun radiation to reach the plant’s other leaves43. Because of this, the seed index for these two cultivars under intercropping was less significant than it was for solid cultivars. Intercropping, however, had no effect on the seed index of the soybean cultivars C14 and PI 399035 because it appears that both cultivars are sensitive to high temperatures, which results in significant levels of photorespiration. Therefore, in order to maintain the rate of nutrient intake during pod filling, intercropping would likely diminish photorespiration.
Genotypes of soybeans that can withstand larger yields from solid planting may also react similarly to intercropping planting33,44. The high absorption of light intensity inside the canopies of soybean cultivars Dr-101, Hill, Holladay and Woodworth is the cause of their high seed yield/ha (Fig. 2 and 3), which had a positive impact on the seed index during growth and development. Soybean cultivar Giza 22 had narrow leaves34, which had a positive effect on dry matter accumulation during growth and development. This is in contrast to soybean cultivar C34, which may have had a high seed yield/ha because of its high efficiency in using low light intensity (Fig. 3). Intercropping had no discernible effect on the seed yield/ha of the soybean genotypes Columbus, DR-101, Forrest, Hill, Woodworth, C14, C34, Giza 22, PI 398408 and PI 399035. Because of its nematode resistance, which was linked to its high yield, the soybean cultivar Forrest was tolerant of intercropping45.
In the meantime, the intercropping tolerance of the soybean cultivar Woodworth was demonstrated by the fact that the shading effects of corn plants had no effect on the seed index. This led to a greater buildup of dry matter throughout development and growth. In the meantime, solid and intercropping plantings did not substantially differ in terms of seed yield per plant because the soybean cultivar Dr-101 was tolerant of intercropping (Table 2). Because the narrow leaves of the soybean cultivar Giza 22 allow the maximum amount of solar radiation to reach the lower leaves, this cultivar’s tolerance to intercropping can be attributed to the wide range of solar radiation that its leaves receive (Fig. 2 and 3). Because the seed output per plant did not differ significantly between intercropping and solid plantings, the soybean cultivar Columbus was tolerant of intercropping (Table 2). Because the soybean cultivar Hill matured under intercropping at almost the same period as under solid farming, it was tolerant of intercropping33.
The study indicated that intercropping had no negative effect on the cultivar Hill’s number of branches. This demonstrates that the shade of corn plants had no detrimental effects on the metabolic exchanges occurring within the cells of soybean leaves. Because the soybean genotypes C14, PI 399035 and PI 398408 were tolerant to intercropping, intercropping had no effect on the weight of 100 seeds. Because of the total leaf chlorophyll content, soybean genotype C34 was resistant to intercropping and intercropping had no effect on the roots33.
With regard to seed quality, the data shows no significant nitrogen uptake advantage under intercropping planting when light intensity supply was limited as compared with solid soybean. With respect to seed oil content, the multiplicity of soybean genotypes and their different maturity groups concealed the effect on the significance of seed oil content between intercropping and solid plantings. High temperature appears to increase the level of oleic acid compared to linoleic acid and linolenic acid in the oil and vice versa when intercropping soybeans with corn. Soybean grown in warmer climates produced more oleic acid and in cooler climates produced a greater percentage of linoleic and linolenic acids46. Increasing the level of oleic acid in the oil appears to reduce the levels of linoleic and linolenic acids of the total fatty acid content of soybeans. These results were in agreement with Lee et al.47, who reported that there is a positive correlation between high oleic acid in seeds and high mean temperature during seed filling.
Although seed oil content was not affected significantly by shading effects of corn plants, seed oleic content was decreased by intercropping as compared with solid one. This shows that intercropping makes the quality of soybean seeds relatively inclined to the protein components. Therefore, it can be mixed with corn grains to be used as feed for ruminants and non-ruminants. While solid plantings raise the quality of seed oil content, this is not suitable for forage purposes. With respect to seed fiber content, the results could be due to high intra-competition between corn and soybean for available growth resources.
It seems that soybean genotypes Woodworth, Forrest, Bellatti L263, Dr-101 and Clark had low seed carbohydrate content, which improves nutritional value of the meal. The Asian soybean genotypes appear to have high seed carbohydrates content, which reduces the quality of the meal. The high oil content of the seeds is doubly useful in Bellatti L263 for use as cooking oil as well as for the production of soybean meal, once the oil has been completely removed.
High oleic acid in seeds of soybean genotypes Forrest, Woodworth, Bellatti L263, Clark and Giza 35 should have desirable agronomic and compositional traits such as a high seed yield, protein and oil concentrations compared to others48, which perfectly matches with soybean genotype Bellatti L263. It is expected that Bellatti L263 has genes responsible for the increase in the level of oleic acid in its oil and not as a result of environmental conditions. An increased oleic acid concentration improves the nutritional value and oxidative stability of soybean seed oil. Thus, it appears that the oil of Bellatti L263 could be used at high cooking temperatures, as well as in pharmaceuticals and cosmetics. Asian soybean genotypes appear to have genes responsible for the increased level of linolenic acid in their oil rather than as a result of environmental conditions49.
The insignificant interactions between the cropping systems and soybean genotypes were similar to those observed by Metwally et al.44, who reported that shading effects of corn did not affect seed oil content in soybean genotypes. Also, Metwally et al.44 reported that, shading effects of corn did not affect seed protein content in soybean genotypes. The data show that each of these two factors act independently on seed quality.
This study gives preliminary principles that intercropping reduced seed oil and fiber contents, which confirm that intercropping decreased the quality of the seed oil, while solid planting increased seed oil quality. This study also reveals that corn grains with seeds of the Egyptian and Asian (Chinese and Korean) genotypes, as well as American genotypes (Toano, Crawford, Holladay, MD 77-5675 and Union) are suitable for feeding broiler chicks. Soybean oil is used widely in rations for broiler chicks as a feed-grade fat to increase the energy density of feeds and improve the efficiency of feed utilization3. The high energy value of soybean oil is attributed to its high percentage of unsaturated fatty acids (oleic acid), which are well absorbed and utilized as a source of energy by chickens50. Feeding chickens on corn grains is known to have a negative effect by decreasing the antioxidant function51. Some studies suggest that adding soybean seeds to a diet of corn grains to feed broiler chicks will increase meat quantity and quality. This increase is due to soybean genotypes with high oil content in their seeds. Soybean oil decreases the digesta passage rate in the gastrointestinal tract, which permits enhanced nutrient absorption present in the diet52. This indicates that the addition of seeds/meal of the tested American soybean genotypes (Crawford, Holladay, MD 77-5675 and Union) as well as the Egyptian soybean cultivar Giza 111 with corn grains will increase meat quantity and quality of broiler chicks.
There were no statistically significant differences between the three groups fed with seeds differing in the fiber content of the diet, as the broiler chicks consumed approximately equal values of the feed53. This confirms that the level of fiber can be ignored in the seeds/meal of soybean genotypes suitable for feeding broiler chicks. With respect to protein content, Beghoul et al.54 found that the partial change of soybean (low protein) did not affect the biochemical appearance, so there were no significant differences in the carcass yield of broiler chicks fed with high protein (faba bean) compared to feeding on low protein soybean. Therefore, it is preferable to exclude seeds/meal of the studied Asian soybean genotypes (Chinese: C7, C14 and C34; Korean: PI 398408 and PI 399035), the American soybean genotypes (Crawford and Toano), as well as the Egyptian soybean genotypes (Giza 22 and Giza 35) from broiler chicks feed.
Corn grains with seeds of the American soybean genotypes (Bellatti L263, Forrest and Woodworth) are suitable for feeding tilapia. Solvent-extraction of the oil results in products that typically contain 44% crude protein if the soybean hulls are included or 48% crude protein without the hulls12. It is clear that the soybean seeds used for feeding fish (tilapia) must have low oil content and high protein content and this is exactly what applies to the seeds of soybean genotype Woodworth, therefore the seeds of the other two soybean genotypes (Bellatti L263 and Forrest) were excluded. Therefore, corn grains should be added to soybean seeds to feed tilapia because increasing the level of soybean seeds in the fish diet has a negative effect on growth parameters55. It was found that feeding tilapia on corn gluten meal reduces red and white blood cells as well as globulin, which negatively affected the survival rate compared to feeding it on corn gluten meal+soybean meal56.
While, corn grains with seeds of the American soybean genotypes (Dr-101 and Clark) are suitable for calves and buffalo. The polyunsaturated fatty acids in soybean oil appear to have an energy-independent effect on improving reproduction in dairy calves and buffalo, so increasing oleic acid in soybean oil does not increase the reproduction of calves and buffalo. This made seeds of two soybean genotypes (Clark and Dr-101) well suited with corn grains for feeding calves and buffalo.
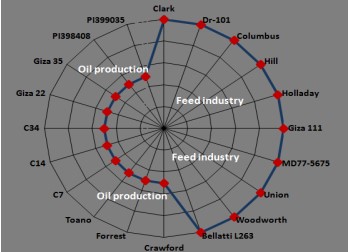
Finally, corn grains with seeds of the American soybean genotypes (Columbus and Hill) are suitable for ducks and geese (Fig. 4). Seeds of the two soybean genotypes (Columbus and Hill) are high in oil and oleic acid contents. Hence, their seeds are characterized by increasing energy density and higher feeding efficiency3, which ducks and geese could use as an energy source50. Recent studies have shown that adding soybean oil to corn grains increases duck meat quality by significantly increasing the feed conversion ratio from 1 to 14 days57, which increases growth performance. This is in complete agreement with seeds of the two soybean genotypes Columbus and Hill which are characterized by an increase in the oil and oleic contents. Thus, soybean genotypes Bellatti L263, Crawford, Forrest, Toano, C7, C14, C34, Giza 22, Giza 35, PI 398408 and PI 399035 could be suitable for oil production, not for the feed industry. The proportion of the studied soybean genotypes suitable for the feed industry amounted to 45% of the total studied soybean genotypes, these genotypes are Clark, Dr-101, Columbus, Hill, Holladay, Giza 111, MD 77-5675, Union and Woodworth (Fig. 4). Meanwhile, the percentage of the remaining soybean genotypes for oil production reached 55%, these genotypes are Bellatti L263, Crawford, Forrest, Toano, C7, C14, C34, Giza 22, Giza 35, PI 398408 and PI 399035.
Based on the foregoing, it will be assumed that the calves/buffalo, ducks/geese, broiler chicks or tilapia will be fed on seeds of intercropped soybean genotypes (Clark, Columbus, DR-101, Hill, Holladay, Giza 111, MD 77-5675, Union or Woodworth) with corn, whose seed quality has proven to be suitable for their feeding. That is, seeds of high-quality soybean genotypes (Clark, Columbus, DR-101, Hill, Holladay, Giza 111, MD 77-5675, Union, or Woodworth) with corn grains can increase meat production when feeding cattle, poultry or fish compared to feeding them on corn grains only.
|
With respect to competitive relationships, Woodworth, Dr-101, C34 and Hill had higher competition with corn than the others. Differences between soybean genotypes were attributed to the fact that these genotypes were developed for growth in different climate zones according to their maturity group and growth habits (Table 1). The growth habit appears to be the main effect of increasing soybean genotype under intercropping and not the maturity group because the soybean genotype Woodworth is earlier than Dr-101. Soybean genotypes Woodworth and Dr-101 had the highest light intensity (Fig. 2 and 3), which allowed more light to reach the lower canopy and stimulate the shaded leaves, thereby potentially improving canopy photosynthesis. As mentioned earlier, soybean genotype Hill is tolerant to low light-intensity or shade tolerance because it has a higher elasticity or plasticity in morphology and physiology to respond to changing environmental growth. Soybean genotype C34 was tolerant to intercropping as a result of total leaf chlorophyll content and roots were not affected by intercropping33. Thus, soybean genotypes Woodworth, Dr-101, Hill or C34 had higher yield potential under intercropping (Table 2) which reflected positively on RY soybean, LERs and LEC.
With respect to intercropping soybean genotypes Union, PI 398408, PI 399035, Bellatti L263, MD 77-5675, or C7 with corn, these genotypes are late maturing, which makes them negatively affected by the shading of corn plants. Early-maturing groups produce a better yield in intercropping compared to late and medium-maturing groups33. Thus, intercropping soybean genotypes Union, PI 398408, PI 399035, Bellatti L263, MD 77-5675 or C7 with corn had lower competitive ability under the intercropping system with 2:2 configurations.
With respect to farmer’s benefit, Woodworth, Dr-101, C34, Hill, Giza 22, Holladay, Clark or Giza 111 with corn had the highest soybean income, without any significant differences between them, as compared with the others. The high potential yield of Woodworth, Dr-101, C34, Hill, Giza 22, Holladay, Clark or Giza 111 was the cause of increasing soybean income by intercropping with corn. Higher MAI of Woodworth, Dr-101, C34, Hill, Giza 22, Holladay, Clark, Forrest, Crawford or Giza 111 could be due to higher their relative yields and LERs. In general, the high economic return for intercrops suggests that intercropping soybean with corn is profitable. These findings are parallel with those obtained by Metwally et al.22, who reported that MAI was positive for all intercropped soybean cultivars with corn cultivar yellow single cross 3062, which shows definite yield and economic advantages compared with solid plantings of both crops.
CONCLUSION
Our findings may indicate that the feed sector can benefit from intercropping corn with soybean cultivars Clark, Dr-101, Hill, Holladay, Giza 111 or Woodworth. Given their greater LERs and net returns/ha, these genotypes ought to be suggested to Egyptian farmers. Intercropping these specific soybean cultivars with corn has the potential to improve overall crop productivity and profitability in the feed sector. Implementing these genotypes could lead to a more sustainable and efficient agricultural system in Egypt. By diversifying crop selection and utilizing these high-performing soybean cultivars, farmers can enhance their economic returns while also promoting environmental sustainability. Further research and field trials are needed to assess the long-term impact of intercropping corn with these specific soybean genotypes in different regions of Egypt.
SIGNIFICANCE STATEMENT
Intercropping soybean genotypes with corn has been shown to increase seed yield and sustainability compared to solid planting. Farmers who utilize this information to make informed decisions can improve profitability and adopt better agricultural practices. By implementing intercropping strategies, farmers can boost yields and promote environmental sustainability. Intercropping techniques can enhance overall sustainability and productivity for farmers. It is important for farmers to consider these results when planning their plantings and crop rotations. Intercropping can also improve soil health by diversifying root systems and enhancing nutrient uptake. Furthermore, intercropping can reduce the need for chemical inputs, leading to cost savings and a reduced environmental impact. By incorporating intercropping techniques, farmers can achieve a more profitable and sustainable agricultural system. Overall, farmers who adopt intercropping practices can not only benefit financially but also contribute to a healthier environment for future generations.
REFERENCES
- Steinfeld, H., P. Gerber, T.D. Wassenaar, V. Castel, M. Rosales, M. Rosales and C. de Haan, 2006. Livestock’s Long Shadow: Environmental Issues and Options. Food & Agriculture Organization, Rome, Italy, Pages: 390.
- Howlader, S., K.R. Sumi, S. Sarkar, S.M. Billah, M.L. Ali, J. Howlader and M. Shahjahan, 2023. Effects of dietary replacement of fish meal by soybean meal on growth, feed utilization, and health condition of stinging catfish, Heteropneustes fossilis. Saudi J. Biol. Sci., 30..
- Sell, J.L., L.G. Tenesaca and G.L. Bales, 1979. Influence of dietary fat on energy utilization by laying hens. Poult. Sci., 58: 900-905.
- Banaszkiewicz, T., 2011. Nutritional Value of Soybean Meal. In: Soybean and Nutrition, El-Shemy, H. (Ed.). InTech Publisher, Croatia, ISBN: 978-953-307-536-5, pp: 1-20.
- Specht, J.E., D.J. Hume and S.V. Kumudini, 1999. Soybean yield potential-A genetic and physiological perspective. Crop Sci., 39: 1560-1570.
- Sultan, S.M., N. Dikshit and U.J. Vaidya, 2015. Oil content and fatty acid composition of soybean (Glysine max L.) genotypes evaluated under rainfed conditions of Kashmir Himalayas in India. J. Appl. Nat. Sci., 7: 910-915.
- Lersten, N.R. and J.B. Carlson, 2004. Vegetative Morphology. In: Soybeans: Improvement, Production, and Uses, Shibles, R.M., J.E. Harper, R.F. Wilson and R.C. Shoemaker (Eds.), American Society of Agronomy, Crop Science Society of America, and Soil Science Society of America, Madison, Wisconsin, ISBN: 9780891182665, pp: 15-57.
- Rotzler, D., P. Stamp, C.A. Betrix, J.C. Degroote, O. Moullet and A. Schori, 2009. Agronomic interest of the lanceolate leaf in soybeans [In French]. Swiss Agric. Rev., 41: 153-160.
- Dei, H.K., 2011. Soybean as a Feed Ingredient for Livestock and Poultry. In: Recent Trends for Enhancing the Diversity and Quality of Soybean Products, Krezhova, D. (Ed.), IntechOpen, London, United Kingdom, ISBN: 978-953-307-533-4, pp: 215-226.
- Çelik, Ö., Ç. Atak and Z. Suludere, 2014. Response of soybean plants to gamma radiation: Biochemical analyses and expression patterns of trichome development. Plant Omics J., 7: 382-391.
- Zhu, R., L. Li, M. Li, Z. Yu, H. Wang and L. Wu, 2020. The effects of substituting fish meal with soy protein concentrate on growth performance, antioxidant capacity and intestinal histology in juvenile golden crucian carp, Cyprinus carpio×Carassius auratus. Aquacult. Rep., 18.
- NRC., 1993. Nutrient Requirements of Fish. National Academy Press, Washington, DC, USA, ISBN-13: 9780309048910, Pages: 128.
- Sohidul Islam, M., I. Muhyidiyn, M.R. Islam, M. Kamrul Hasan and A.S.M.G. Hafeez et al., 2022. Soybean and Sustainable Agriculture for Food Security. In: Soybean-Recent Advances in Research and Applications, Ohyama, T., Y. Takahashi, N. Ohtake, T. Sato and S. Tanabata (Eds.), IntechOpen, United Kingdom, 978-1-80355-700-7,.
- Solomon, S.G., L.O. Tiamiyu and U.J. Agaba, 2007. Effect of feeding different grain sources on the growth performance and body composition of tilapia, (Oreochromis niloticus) fingerlings fed in outdoor hapas. Pak. J. Nutr., 6: 271-275.
- Eastham, N.T., A. Coates, P. Cripps, H. Richardson, R. Smith and G. Oikonomou, 2018. Associations between age at first calving and subsequent lactation performance in UK Holstein and Holstein-Friesian dairy cows. PLoS ONE, 13.
- Houndonougbo, F.M., A. Chwalibog and C.A.A.M. Chrysostome, 2009. Is the nutritional value of grains in broiler chickens’ diets affected by environmental factors of soybean (Glycine max) growing and the variety of maize (Zea maize) in Benin? Livest. Res. Rural Dev., 21.
- Meyer, M.M. and E.A. Bobeck, 2021. Growth performance of male broilers fed ExPress® soybean meal and high-shear dry extruded corn. J. Appl. Poult. Res., 30.
- Abdel-Wahab, E.I., M.K.A. Mohamed, M.A. Baheeg, S.F. Abdel-Rahman and M.H. Naroz, 2024. Response of some soybean genotypes to insect infestation under three mineral nitrogen fertilizer rates. Agric. Sci. Dig., 44: 122-138.
- Kim, H.T., I.Y. Baek, Y.J. Oh, S.K. Cho and W.Y. Han et al., 2013. A new soybean cultivar ‘wonheug’ for sprout with small seed, black seed coat and disease tolerance. Korean J. Breed. Sci., 45: 273-277.
- Hwang, T.Y., B.S. Gwak, J. Sung and H.S. Kim, 2020. Genetic diversity patterns and discrimination of 172 Korean soybean (Glycine max (L.) Merrill) varieties based on SSR analysis. Agriculture, 10.
- Abdel-Galil, A.M., T.I. Abdel-Wahab and S.I. Abdel-Wahab, 2014. Productivity of four soybean varieties as affected by intercropping with corn planting geometry. Soybean Res., 12: 36-58.
- Metwally, A.A., S.A. Safina, T.I. Abdel-Wahab, S.I. Abdel-Wahab and Y.A.A. Hefny, 2018. Productivity of soybean varieties under intercropping culture with corn in Egypt. Soybean Res., 16: 63-77.
- AOAC and W. Horwitz, 2000. Official Methods of Analysis of AOAC International. 17th Edn., Association of Official Analytical Chemists, Gaithersburg, Maryland, ISBN: 9780935584677.
- Sadasivam, S. and A. Manickam, 1996. Biochemical Methods. 1st Edn., New Age International Publishers, New Delhi, India, ISBN: 81-224-0976-8, Pages: 255.
- Mead, R. and R.W. Willey, 1980. The concept of a ‘Land Equivalent Ratio’ and advantages in yields from intercropping. Exp. Agric., 16: 217-228.
- Adetiloye, P.O., F.O.C. Ezedinma and B.N. Okigbo, 1983. A Land Equivalent Coefficient (LEC) concept for the evaluation of competitive and productive interactions in simple to complex crop mixtures. Ecol. Modell., 19: 27-39.
- Abd El-Alim, A.M., S.A. Safina, T.I. Abdel-Wahab and S.I. Abdel-Wahab, 2019. Growing of twenty soybean genotypes in solid and intercropping systems with corn. Res. Crops, 20: 47-57.
- Tripathi, S.C., K. Venkatesh, R.P. Meena, S. Chander and G.P. Singh, 2021. Sustainable intensification of maize and wheat cropping system through pulse intercropping. Sci. Rep., 11.
- Gomez, K.A. and A.A. Gomez, 1984. Statistical Procedures for Agricultural Research. 2nd Edn., John Wiley and Sons, Hoboken, New Jersey, ISBN: 9780471870920, Pages: 704.
- Huber, M., N.M. Nieuwendijk, C.K. Pantazopoulou and R. Pierik, 2021. Light signalling shapes plant-plant interactions in dense canopies. Plant Cell Environ., 44: 1014-1029.
- Hussain, S., T. Liu, N. Iqbal, M. Brestic and T. Pang et al., 2020. Effects of lignin, cellulose, hemicellulose, sucrose and monosaccharide carbohydrates on soybean physical stem strength and yield in intercropping. Photochem. Photobiol. Sci., 19: 462-472.
- Teiz, L. and E. Zeiger, 2002. Plant Physiology. 3rd Edn., Sinauer Associates, Sunderland, Massachusetts, ISBN: 9780878938230, Pages: 690.
- Metwally, A.E.A.A., S.A. Safina, E.I. Abdel-Wahab, S.I. Abdel-Wahab and T.I. Abdel-Wahab, 2021. Screening thirty soybean genotypes under solid and intercropping plantings in Egypt. J. Crop Sci. Biotechnol., 24: 203-220.
- Metwally, A.A., M.M. Shafik, K.E. El-Habbak and S.I. Abdel-Wahab, 2012. Yield and soybean characters under some intercropping patterns with corn. Soybean Res., 10: 24-42.
- Metwally, A.A., T.I. Abdel-Wahab and S.I. Abdel-Wahab, 2019. Increasing land and water use efficiencies by intercropping summer legumes with corn in Egypt. Int. J. Agric. Biol. Res., 35: 6-12.
- Abdel-Wahab, E.I., M.H. Naroz and S.F.A. El-Rahman, 2019. Potential of some soybean varieties for resistance to lima bean pod borer (Etiella zinckenella) under field conditions. Res. Crops, 20: 389-398.
- Abdel-Wahab, T., E. Abdel-Wahab, A.M. Taha, M.M. Adel and H.M. Hussein, 2020. Varietal response of soybean to applied irrigation water and insects incidence under different intercropping systems with maize. Res. Crops, 20: 1-25.
- Cheng, B., L. Wang, R. Liu, W. Wang and R. Yu et al., 2022. Shade-tolerant soybean reduces yield loss by regulating its canopy structure and stem characteristics in the maize-soybean strip intercropping system. Front. Plant Sci., 13.
- Suhre, J.J., N.H. Weidenbenner, S.C. Rowntree, E.W. Wilson and S.L. Naeve et al., 2014. Soybean yield partitioning changes revealed by genetic gain and seeding rate interactions. Agron. J., 106: 1631-1642.
- Perkasa, A.Y., 2020. Responses of two soybean cultivars on growth and development in two different light intensities. Black Sea J. Agric., 3: 17-24.
- Hartwig, E.E. and J.M. Epps, 1973. Registration of ‘Forrest’ soybeans. Crop Sci., 13: 287-287.
- Abdel-Wahab, T.I. and R.A. Abd El-Rahman, 2016. Response of some soybean cultivars to low light intensity under different intercropping patterns with maize. Int. J. Appl. Agric. Sci., 2: 21-31.
- Gadallah, R.A. and T.A. Selim, 2014. Distributions of soybean and corn plants in intercropping and solid patterns. Soybean Res., 14: 14-31.
- Metwally, A.E.A.A.R., S.A. Safina and N.A.E.S. Saleh, 2021. The productivity of intercropping some soybean varieties with corn under low levels of irrigation water. Plant Cell Biotechnol. Mol. Biol., 22: 285-300.
- Carbone, G.J., L.O. Mearns, T. Mavromatis, E.J. Sadler and D. Stooksbury, 2003. Evaluating CROPGRO-soybean performance for use in climate impact studies. Agron. J., 95: 537-544.
- Wolf, R.B., J.F. Cavins, R. Kleiman and L.T. Black, 1982. Effect of temperature on soybean seed constituents: Oil, protein, moisture, fatty acids, amino acids and sugars. J. Am. Oil Chem. Soc., 59: 230-232.
- Lee, J.D., M. Woolard, D.A. Sleper, J.R. Smith and V.R. Pantalone et al., 2009. Environmental effects on oleic acid in soybean seed oil of plant introductions with elevated oleic concentration. Crop Sci., 49: 1762-1768.
- Kim, H.J., B.K. Ha, K.S. Ha, J.H. Chae and J.H. Park et al., 2015. Comparison of a high oleic acid soybean line to cultivated cultivars for seed yield, protein and oil concentrations. Euphytica, 201: 285-292.
- Wee, C.D., M. Hashiguchi, T. Anai, A. Suzuki and R. Akashi, 2017. Fatty acid composition and distribution in wild soybean (Glycine soja) seeds collected in Japan. Asian J. Plant Sci., 16: 52-64.
- Huyghebaert, G., G. de Munter and G. de Groote, 1988. The metabolisable energy (AMEn) of fats for broilers in relation to their chemical composition. Anim. Feed Sci. Technol., 20: 45-58.
- McFarlane, J.M., S.E. Curtis, R.D. Shank and S.G. Carmer, 1989. Multiple concurrent stressors in chicks.1. Effect on weight gain, feed intake and behavior. Poult. Sci., 68: 501-509.
- Baiao, N.C. and L.J.C. Lara, 2005. Oil and fat in broiler nutrition. Braz. J. Poult. Sci., 7: 129-141.
- Abdel-Malak, N.Y., M.S. Dessouky and T.M. Younis, 2000. Effect of dietary extruded full-fat soybean seed on broiler performance. J. Anim. Poult. Prod., 25: 3209-3220.
- Beghoul, S., K. Beroual, M.C. Abdeldjelil and S. Abdelghani, 2022. The effect of low soybean meal diets on broiler performance. Bangladesh J. Vet. Med., 20: 1-9.
- Sharda, O.P. Sharma and V.P. Saini, 2017. Replacement of fishmeal with soybean meal in Nile tilapia (Oreochromis niloticus) diet. J. Entomol. Zool. Stud., 5: 845-849.
- Ismail, T., E. Hegazi, M.A.O. Dawood, E. Nassef, A. Bakr, B.A. Paray and H. van Doan, 2020. Using of betaine to replace fish meal with soybean or/and corn gluten meal in Nile tilapia (Oreochromis niloticus) diets: Histomorphology, growth, fatty acid, and glucose-related gene expression traits. Aquacult. Rep., 17.
- Qamar, S.H., Q. Zeng, X. Ding, S. Bai and J. Wang et al., 2019. Effect of oil supplementation on growth performance, meat quality and antioxidative ability in meat ducks fed a diet containing aging corn. Int. J. Agric. Biol., 21: 201-208.
How to Cite this paper?
APA-7 Style
Metwally,
A.A., Salheen Saleh,
N.A., Abdel-Wahab,
E.I., Hefny,
Y.A. (2024). Intercropping Some Soybean Genotypes with Corn for Producing Soybean Seeds, Quality and Land Equivalent Ratios. Asian Journal of Biological Sciences, 17(3), 331-350. https://doi.org/10.3923/ajbs.2024.331.350
ACS Style
Metwally,
A.A.; Salheen Saleh,
N.A.; Abdel-Wahab,
E.I.; Hefny,
Y.A. Intercropping Some Soybean Genotypes with Corn for Producing Soybean Seeds, Quality and Land Equivalent Ratios. Asian J. Biol. Sci 2024, 17, 331-350. https://doi.org/10.3923/ajbs.2024.331.350
AMA Style
Metwally
AA, Salheen Saleh
NA, Abdel-Wahab
EI, Hefny
YA. Intercropping Some Soybean Genotypes with Corn for Producing Soybean Seeds, Quality and Land Equivalent Ratios. Asian Journal of Biological Sciences. 2024; 17(3): 331-350. https://doi.org/10.3923/ajbs.2024.331.350
Chicago/Turabian Style
Metwally, Abd El-Alim, Abd El-Rhman, Neama Abd El Salheen Saleh, Eman Ibrahim Abdel-Wahab, and Yaser Ahmed Abd El-Halim Hefny.
2024. "Intercropping Some Soybean Genotypes with Corn for Producing Soybean Seeds, Quality and Land Equivalent Ratios" Asian Journal of Biological Sciences 17, no. 3: 331-350. https://doi.org/10.3923/ajbs.2024.331.350

This work is licensed under a Creative Commons Attribution 4.0 International License.